
Figures & data
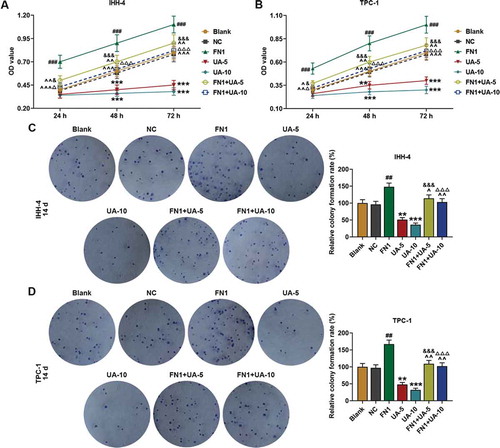
Table 1. Primer for qRT-PCR
Figure 1. UA inhibited papillary thyroid carcinoma (PTC) cells (IHH-4 and TPC-1 cell) viability and clone formation while promoted cell apoptosis and the effects were positively correlated with UA concentration. (a-b) IHH-4 and TPC-1 cell viability after UA treatment at different concentrations (5 μmol/L or 10 μmol/L) for 24 h, 48 h and 72 h was determined by MTT assay. (c-d) IHH-4 and TPC-1 cell clone formation rate after UA treatment at different concentrations (5 μmol/L or 10 μmol/L) for 14 days was investigated by plate clone formation assay. (e-f) IHH-4 and TPC-1 cell apoptosis after UA treatment at different concentrations (5 μmol/L or 10 μmol/L) for 48 h was measured by flow cytometry. All experiments have been performed in triplicate and experimental data were expressed as mean ± standard deviation (SD). (*P < 0.05, **P < 0.01, ***P < 0.001, vs. Control) UA: ursolic acid
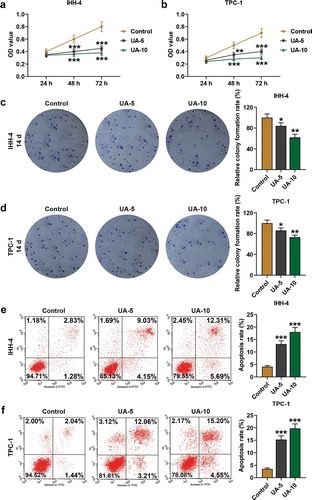
Figure 2. UA promoted papillary thyroid carcinoma (PTC) cells proapoptotic proteins expressions. (a) Relative protein expressions of Bcl-2, Bax, and C(cleaved)-caspase-3 expressions in IHH-4 cell after UA treatment (5 μmol/L or 10 μmol/L) were detected by western blot. GAPDH was used as an internal reference. (b) Relative mRNA expressions of Bcl-2 and Bax in IHH-4 cell after UA treatment (5 μmol/L or 10 μmol/L) were measured by quantitative real-time polymerase chain reaction (qRT-PCR). GAPDH was used as an internal reference. (c) Relative protein expressions of Bcl-2, Bax, and C(cleaved)-caspase-3 expressions in TPC-1 cell after UA treatment (5 μmol/L or 10 μmol/L) were detected by western blot. GAPDH was used as an internal reference. (d) Relative mRNA expressions of Bcl-2 and Bax in TPC-1 cell after UA treatment (5 μmol/L or 10 μmol/L) were measured by qRT-PCR. GAPDH was used as an internal reference. All experiments have been performed in triplicate and experimental data were expressed as mean ± standard deviation (SD). (*P < 0.05, **P < 0.01, ***P < 0.001, vs. Control) Bax: Bcl-2 Associated X Protein
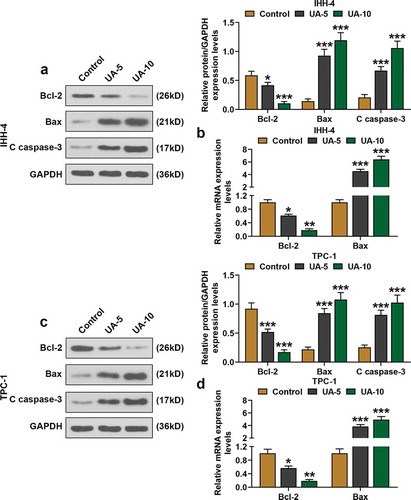
Figure 3. UA inhibited EMT of papillary thyroid carcinoma (PTC) cells. (a-d) Expressions of EMT-related proteins (MMP-2, MMP-9, E-cadherin, N-cadherin and α-SMA) in IHH-4 and TPC-1 cell after UA treatment (5 μmol/L or 10 μmol/L) were measured by qRT-PCR and western blot. GAPDH was used as an internal reference. All experiments have been performed in triplicate and experimental data were expressed as mean ± standard deviation (SD). (**P < 0.01, ***P < 0.001, vs. Control) α-SMA: α-smooth muscle actin; MMP2: Matrix Metallopeptidase 2; MMP9: Matrix Metallopeptidase 9; EMT: epithelial-to-mesenchymal transition
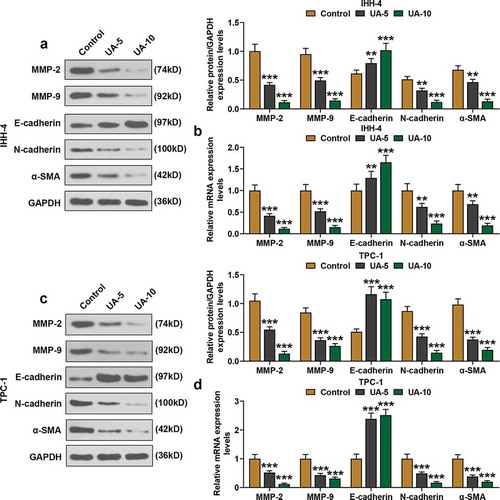
Figure 4. FN1 was higher expressed in thyroid carcinoma and UA suppressed FN1 expression in IHH-4 and TPC-1 cell. (a) FN1 expression in thyroid carcinoma was identified by Gene Expression Profiling Interactive Analysis 2 (GEPIA2; T = 512, N = 337). (b) Relative mRNA expression of FN1 in IHH-4, TPC-1 and Nthy-ori 3–1 cells was detected by qRT-PCR. GAPDH was used as an internal reference. (c-d) Relative mRNA expression of FN1 in IHH-4 and TPC-1 cell after transfection and different concentrations (5 μmol/L or 10 μmol/L) of UA treatment was measured through qRT-PCR. GAPDH was used as an internal reference. All experiments have been performed in triplicate and experimental data were expressed as mean ± standard deviation (SD). (***P < 0.001, vs. Nthy-ori 3–1; ###P < 0.001, vs. NC; &&&P < 0.001, vs. UA-5; ΔΔΔP<0.001, vs. UA-10; ^^P < 0.01, ^^^P < 0.001, vs. FN1; §§P < 0.01, §§§P < 0.001, vs. Blank) FN1: Fibronectin-1
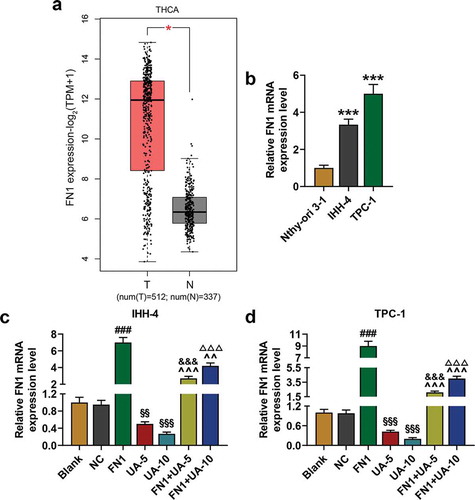
Figure 5. FN1 enhanced papillary thyroid carcinoma (PTC) cells viability and clone formation, which was partially reversed by UA. (a-b) IHH-4 and TPC-1 cell viability after transfection of FN1 overexpression plasmid and treatment of UA (5 μmol/L or 10 μmol/L) for 24 h, 48 h and 72 h was measured by MTT assay. (c-d) IHH-4 and TPC-1 cell clone formation after transfection of FN1 overexpression plasmid and treatment of UA (5 μmol/L or 10 μmol/L) for 14 days was detected by plate clone formation assay. All experiments have been performed in triplicate and experimental data were expressed as mean ± standard deviation (SD). (**P < 0.01, ***P < 0.001, vs. Blank; ##P < 0.01, ###P < 0.001, vs. NC; ^P < 0.05, ^^P < 0.01, ^^^P < 0.001, vs. FN1; &P < 0.05, &&&P < 0.001, vs. UA-5; ΔP<0.05, ΔΔΔP<0.001, vs. UA-10) NC: negative control

Figure 6. FN1 suppressed papillary thyroid carcinoma (PTC) cells apoptosis, which was partially reversed by UA. (a-b) IHH-4 and TPC-1 cell apoptosis after transfection of FN1 overexpression plasmid and treatment of UA (5 μmol/L or 10 μmol/L) for 48 h was detected by flow cytometry. All experiments have been performed in triplicate and experimental data were expressed as mean ± standard deviation (SD). (**P < 0.01, ***P < 0.001, vs. Blank; ##P < 0.01, ###P < 0.001, vs. NC; ^P < 0.05, ^^P < 0.01, vs. FN1; &&P < 0.01, &&&P < 0.001, vs. UA-5; ΔΔΔP<0.001, vs. UA-10)
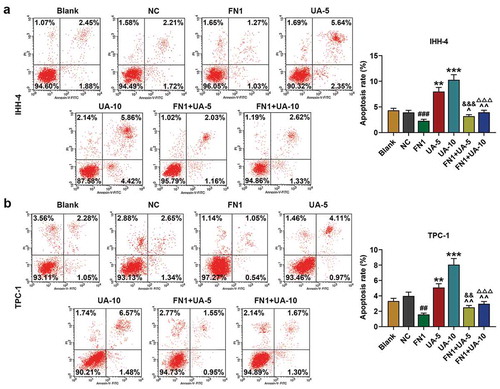
Figure 7. FN1 suppressed papillary thyroid carcinoma (PTC) cells pro-apoptotic proteins expression, which was partially reversed by UA. (a) Relative protein expressions of Bcl-2, Bax, and C (cleaved)-caspase-3 expressions in IHH-4 cell after transfection of FN1 overexpression plasmid and UA treatment (5 μmol/L or 10 μmol/L) were detected by western blot. GAPDH was used as an internal reference. (b) Relative mRNA expressions of Bcl-2 and Bax in IHH-4 cell after transfection of FN1 overexpression plasmid and UA treatment (5 μmol/L or 10 μmol/L) were measured by qRT-PCR. GAPDH was used as an internal reference. (c) Relative protein expressions of Bcl-2, Bax, and C (cleaved)-caspase-3 expressions in TPC-1 cell after transfection of FN1 overexpression plasmid and UA treatment (5 μmol/L or 10 μmol/L) were detected by western blot. GAPDH was used as an internal reference. (d) Relative mRNA expressions of Bcl-2 and Bax in TPC-1 cell after transfection of FN1 overexpression plasmid and UA treatment (5 μmol/L or 10 μmol/L) were measured by qRT-PCR. GAPDH was used as an internal reference. All experiments have been performed in triplicate and experimental data were expressed as mean ± standard deviation (SD). (*P < 0.05, **P < 0.01, ***P < 0.001, vs. Blank; #P < 0.05, ##P < 0.01, ###P < 0.001, vs. NC; ^P < 0.05, ^^P < 0.01, ^^^P < 0.001, vs. FN1; &P < 0.05, &&&P < 0.001, vs. UA-5; ΔP<0.05, ΔΔP<0.01,ΔΔΔP<0.001, vs. UA-10)
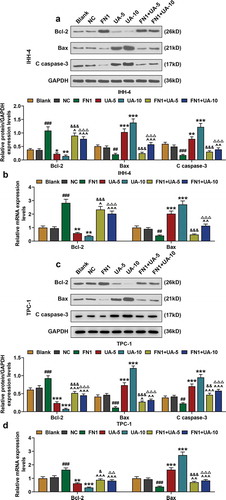
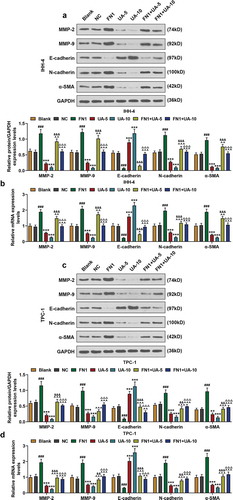
Figure 8. FN1 regulated EMT-related proteins in papillary thyroid carcinoma (PTC) cells, which was partially reversed by UA. (a-b) Expressions of EMT-related proteins (MMP-2, MMP-9, E-cadherin, N-cadherin and α-SMA) in IHH-4 cell after transfection of FN1 overexpression plasmid and UA treatment (5 μmol/L or 10 μmol/L) were measured through qPCR and western blot. GAPDH was used as an internal reference. (c-d) Expressions of EMT-related proteins in TPC-1 cell after transfection of FN1 overexpression plasmid and UA treatment (5 μmol/L or 10 μmol/L) were detected by qRT-PCR and western blot. GAPDH was used as an internal reference. All experiments have been performed in triplicate and experimental data were expressed as mean ± standard deviation (SD). (**P < 0.01, ***P < 0.001, vs. Blank; ###P < 0.001, vs. NC; ^P < 0.05, ^^P < 0.01, ^^^P < 0.001, vs. FN1; &&P < 0.01, &&&P < 0.001, vs. UA-5; ΔΔΔP<0.001, vs. UA-10) EMT: epithelial-to-mesenchymal transition
Data availability statement
The analyzed data sets generated during the study are available from the corresponding author on reasonable request.