Figures & data

Table 1. Summary of epoxy resin systems used in the investigation.
Figure 1. Photograph of microbond test set-up and schematic diagram of test specimen.
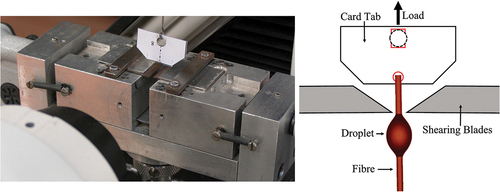
Figure 2. Schematic illustration of FTIR microbond sample preparation.
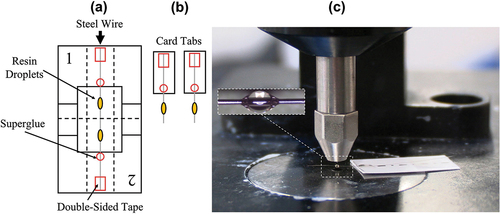
Figure 3. SEM micrographs of plastically deformed (a,b) and successfully debonded (c,d) microbond droplets.
Figure 4. Micrograph of steel filament/epoxy microbond specimen: pre-test and in-situ.
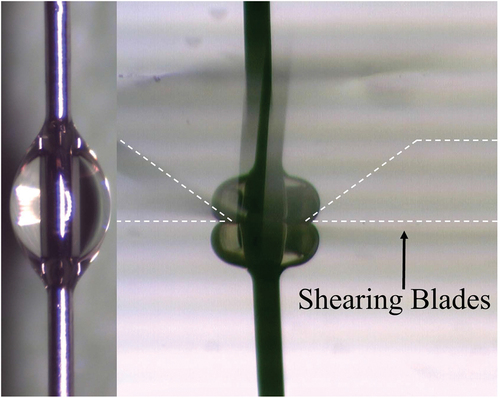
Figure 5. Spectral comparison of glass fibre/Epotec and steel wire/Epotec epoxy droplets.
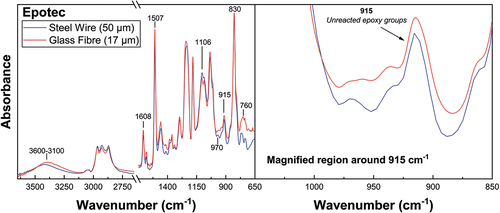
Figure 6. Spectral comparison of glass fibre/332-TETA and steel wire/332-TETA epoxy droplets.
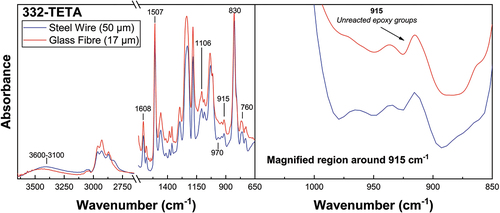
Table 2. Epoxy/amine curing FTIR band assignments.
Figure 7. Spectral comparison of Epotec droplet and bulk matrix specimens cured according to the recommended macroscale schedule.
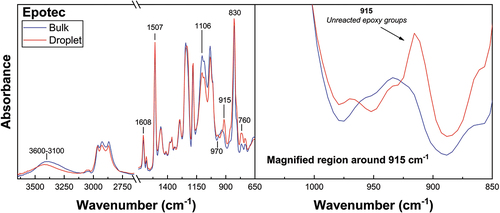
Figure 8. Spectral comparison of Olin droplet and bulk matrix specimens cured according to the recommended macroscale schedule.
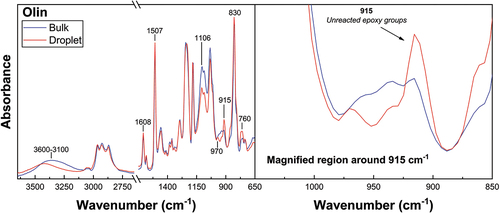
Figure 9. Spectral comparison of 332-TETA droplet and bulk matrix specimens cured according to identical schedules.
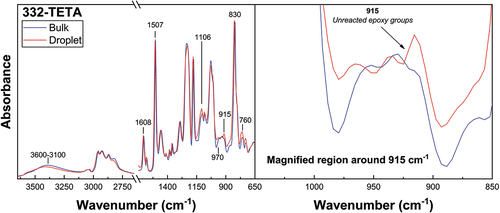
Figure 10. Load–extension curves generated during microbond testing showing (a) semi-plastic behaviour and (b) good debonding.
Figure 11. Relationship between apparent IFSS and pre-cure standing time.
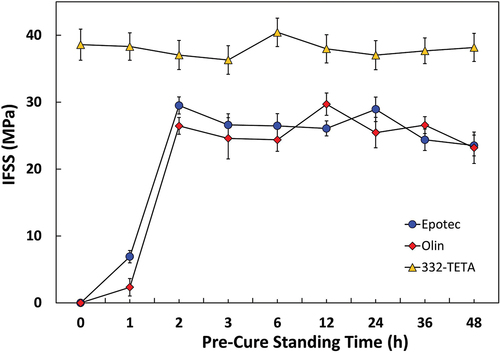
Figure 12. FTIR spectra of microbond droplet specimens and bulk cured matrices after standard cure cycle and with 0–48 h pre-cure.
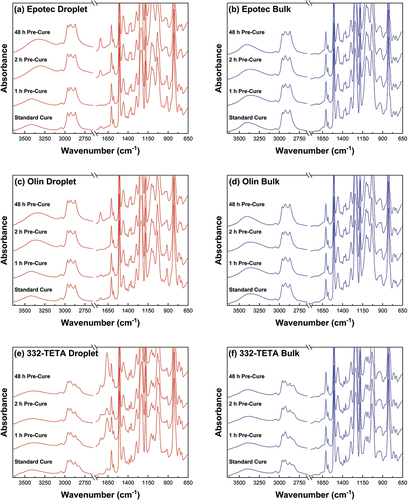
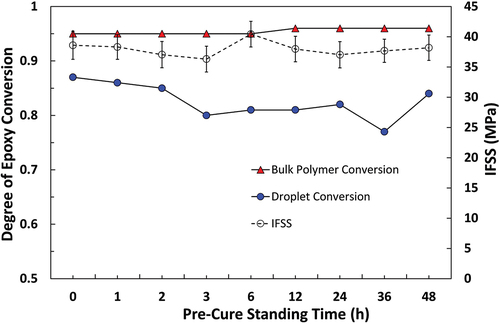
Figure 13. Comparison of apparent IFSS for the Epotec epoxy system and the degree of epoxy conversion in a microdroplet versus a bulk polymer sample with different pre-cure standing times.
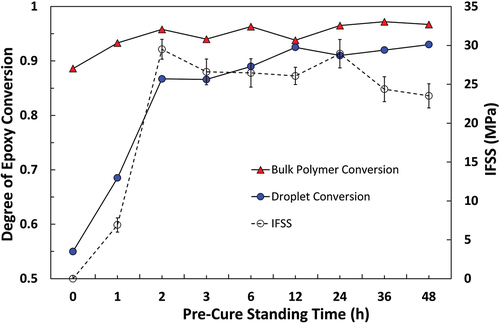
Figure 14. Comparison of apparent IFSS for the Olin epoxy system and the degree of epoxy conversion in a microdroplet versus a bulk polymer sample with different pre-cure standing times.
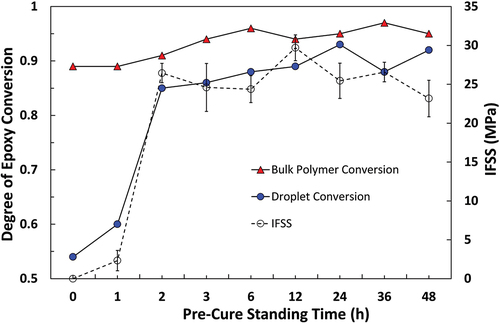
Figure 15. Comparison of apparent IFSS for the 332-TETA epoxy system and the degree of epoxy conversion in a microdroplet versus a bulk polymer sample with different pre-cure standing times.