Figures & data
Figure 1. True stress-true strain curves of Al0.9FeCoNiCr HEAs at different temperatures and four strain rates (a) 0.001 s−1, (b) 0.01 s−1, (c) 0.1 s−1, (d) 1 s−1.
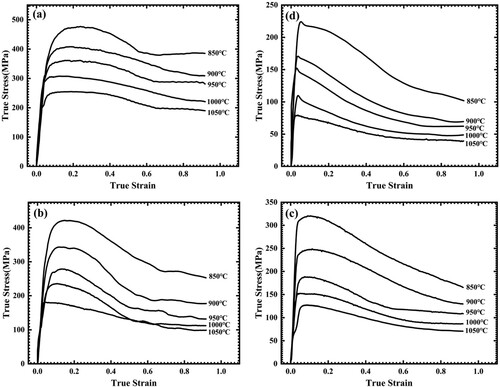
Figure 2. Peak stress and steady-state stress of Al0.9FeCoNiCr HEAs at different temperatures and four strain rates. (a) 0.001 s−1, (b) 0.01 s−1, (c) 0.1 s−1, (d) 1 s−1.
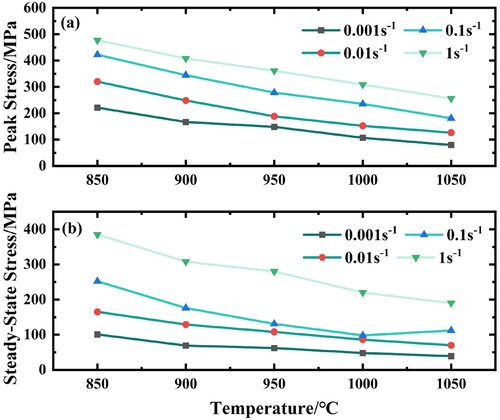
Figure 3. (a) 3D power dissipation map; (b) 2D power dissipation contour map; (c) 3D instability map; (d) 2D instability contour map of Al0.9FeCoNiCr HEA at peak strain.
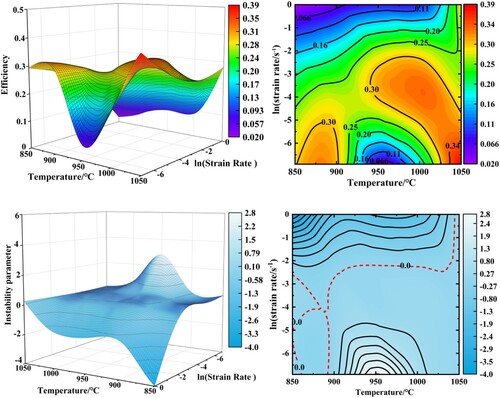
Figure 4. Processing map and two-phase distribution map for Al0.9FeCoNiCr HEA.
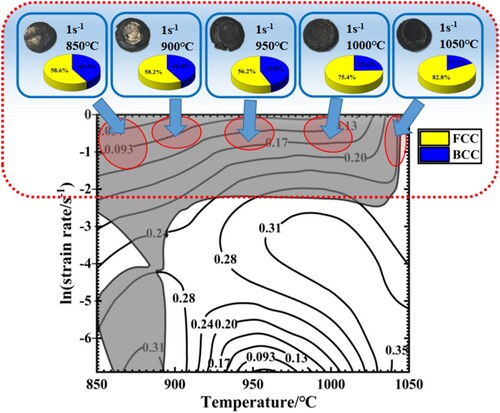
Figure 5. Phase map of Al0.9FeCoNiCr HEA at 1 s−1. (a) 850°C; (b) 900°C; (c) 950°C; (d) 1000°C; (e) 1050°C; (f) two-phase proportional distribution map.
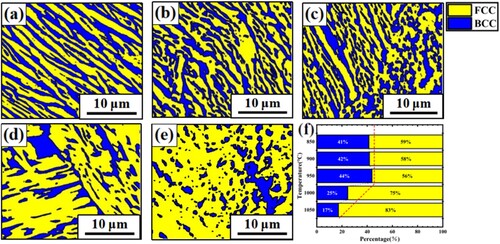
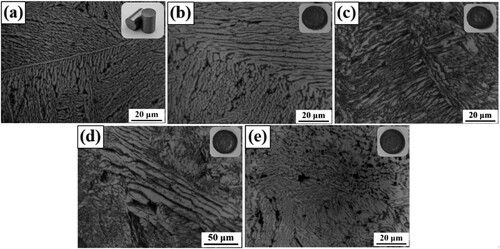
Figure 6. Microstructure of AlFeCoNiMo0.2 HEA at the temperature of 1000°C (a) microstructure illustrations; (b) 1 s−1; (c) 0.1 s−1; (d) 0.01 s−1; (e) 0.001 s−1.