Figures & data
Figure 1. Temperature-dependent IF and relative modulus of sample CR measured in the (a) heating and (b) cooling process; (c) Arrhenius plot of the P2 peak. Fitting profiles of P2 peak (short-dash lines) and background curve (dash lines) are plotted.
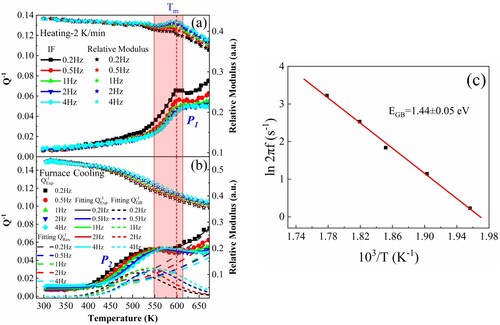
Figure 2. IF-temperature spectra measured at 0.5 Hz with 2 K/min. The total fitting results (solid lines), fRex (blue solid line), the GB peak and the background curves (dash lines) are plotted.
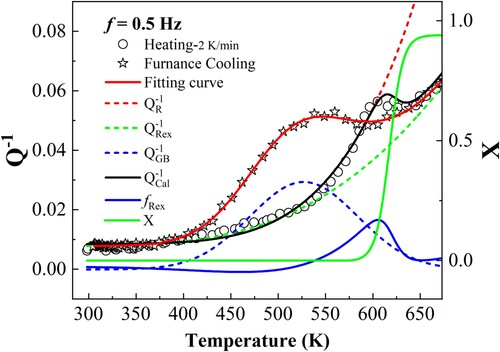
Figure 3. The IF spectra (0.2 Hz) of sample CR measured with the following heating rates: (a) 1 K/min, (b) 2 K/min, (c) 2.5 K/min, (d) 3 K/min, (e) 4 K/min, and (f) 5 K/min.
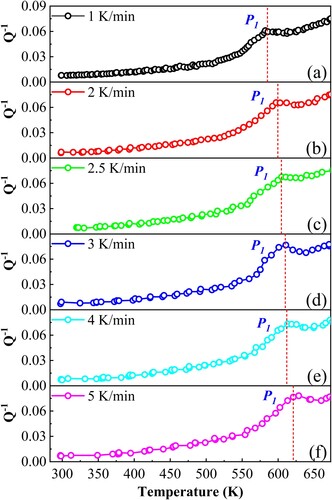
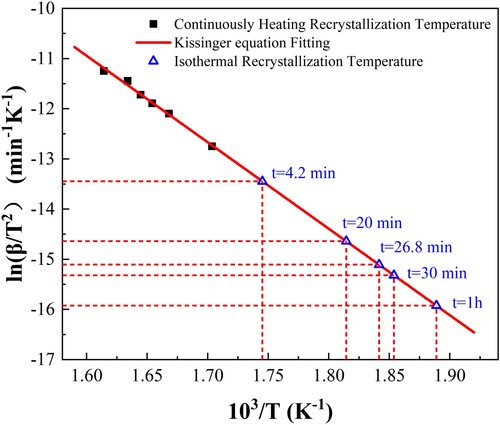
Figure 4. Kissinger plot of sample CR and correlation of with the parameters of continuously heating recrystallisation via the Kissinger equation.