
Figures & data
Figure 1. Overview of women included in the study.
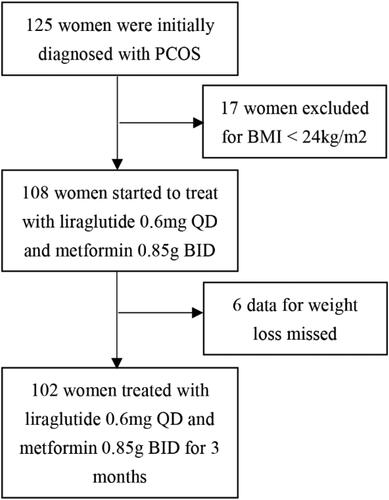
Figure 2. Body weight change at baseline and after therapy.
Panel A shows the mean body weight at baseline and after therapy of those patients. Panel B shows the frequency of patients whose weight changed in [−25%, −20%), [−20%, −15%), [−15%, −10%), [−10%, −5%), [−5%, 0), [0, 5%) compared with their baseline. As we can see, almost people got at least 5% weight loss, and a majority of patients had a weight change in −5% to −15%. Panel C shows the cumulative percentage of patients with the change of body weight after 3 months of treatment.
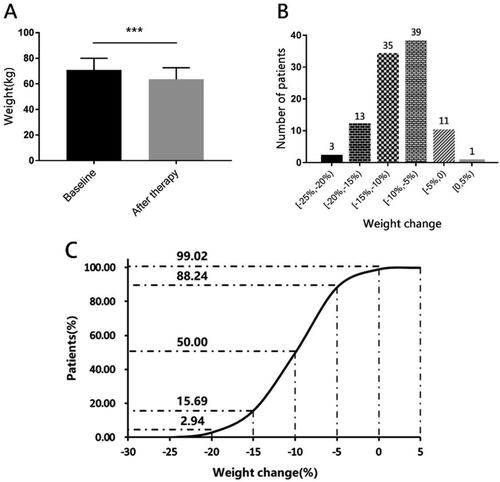
Table 1. Characteristics at baseline and after therapy of low dose of liraglutide combined with metformin for 12 weeks.
Figure 3. The other characteristics change at baseline and after therapy.
Panel A shows body mass index (BMI). Panel B shows waist-hip ratio. Panel C shows visceral fat area. Panel D shows percentage of body fat. All the differences of parameters between baseline and after therapy were analyzed by Student’s paired t-test. ***for p < 0.001.
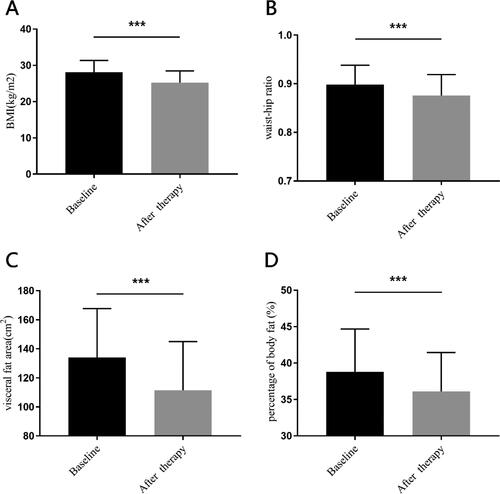
Table 2. Endocrine parameters at baseline and after therapy for 12 weeks.
Table 3. Metabolic parameters at baseline and after therapy for 12 weeks.
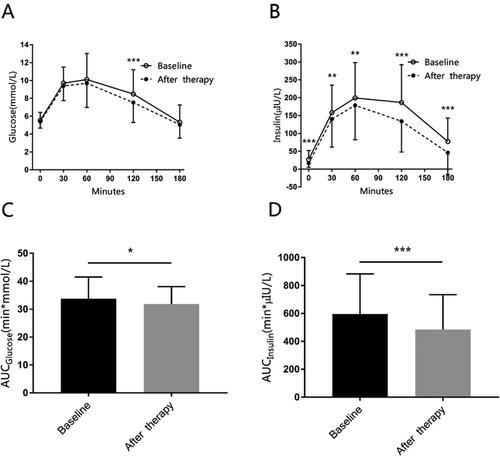
Figure 4. The mean glucose, insulin concentration during OGTT at baseline and after therapy.
Panel A shows glucose concentrations during oral glucose tolerance test (OGTT). Panel B shows insulin concentrations during OGTT. Panel C shows the area under the curve (AUC) of glucose during OGTT. Panel D shows the AUC of insulin during OGTT. The data are presented as means ± SD, and calculated with Student’s paired T-test. *for p < 0.05, ** for p < 0.01, *** for p < 0.001.
Availability of data and materials
The data that support the findings of this study are openly available in [ResMan] at [http://www.medresman.org], reference number [ChiCTR1900024384].