
Figures & data
Table 1. Hormonal and metabolic parameters of PCOS under study (n = 32).
Table 2. Hormonal and metabolic parameters of PCOS patients under study, subdivided according the presence or absence of familial diabetes background.
Figure 1. Response of glucose (left panel), insulin (middle panel) and insulin (right panel) to OGTT before and after 12 weeks of complementary treatment with ALA (400 mg/day) in all PCOS patients (n = 32). ALA treatment significantly decreases all responses. Left panel: ** p < .01, *** p < .007; middle panel: * p < .02, ** p < .006, *** p < .005; right panel: * p < .01, *** p < .0002.
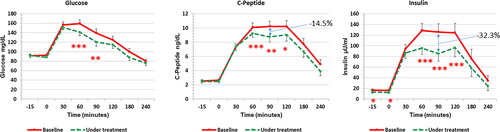
Figure 2. Mean calculated HIE index all along the OGTT. HIE index significantly decreased after ALA treatment interval. * p < .03, ** p < .003, *** p < .001.
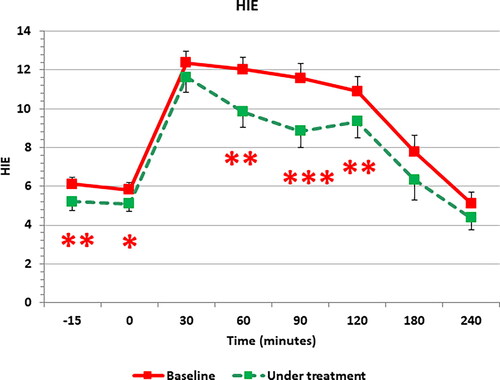
Figure 3. Response of glucose (left panel), insulin (middle panel) and insulin (right panel) to OGTT before and after 12 weeks of complementary treatment with ALA (400 mg/day) in PCOS patients with a history of familial diabetes (n = 20). ALA treatment significantly decreases insulin response but not those of glucose and C-peptide. *** p < .001.
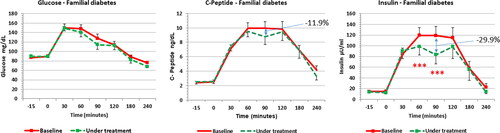
Figure 4. Response of glucose (left panel), insulin (middle panel) and insulin (right panel) to OGTT before and after 12 weeks of complementary treatment with ALA (400 mg/day) in PCOS patients with a familial diabetes background (n = 12). ALA treatment significantly decreases insulin response but not those of glucose and C-peptide. * p < .05.
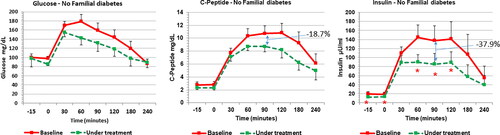
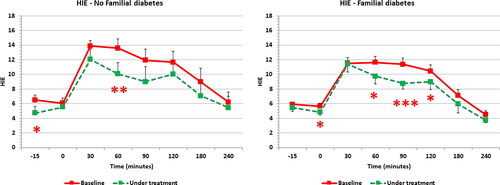
Figure 5. Mean calculated HIE index all along the OGTT for PCOS patients without (left panel) and with familial diabetes background (right panel). This latter group showed the majority of significant changes all along the points of the OGTT. * p < .03, ** p < .01, *** p < .009.
Data availability statement
Data sharing is not applicable to this article.