Figures & data
Figure 1. Bile acids modulate human platelet activation. Human platelet-rich plasma (PRP) was incubated with indicated bile acids for 1 h and 6 h. (A) integrin αIIbβ3 activation and (B) P-selectin externalization after agonist stimulation was measured in flow cytometric analysis to detect platelet activation state. Mean fluorescence intensity (MFI) in the platelet specific FSC/SSC gate was recorded (n = 4). Isolated human platelets were preincubated for 1 h with hydrophilic bile acids (C+D) or hydrophobic bile acids (E+F) and analyzed for their activation pattern (n = 6). Statistical significance was determined by two-way ANOVA with Tukey’s multiple comparisons test. *p < .05, **p < .01. Data shown as mean + SEM. CRP = collagen-related peptide, PAR4 = PAR4 activating peptide. For each bile acid, a concentration of 50 µM was used.
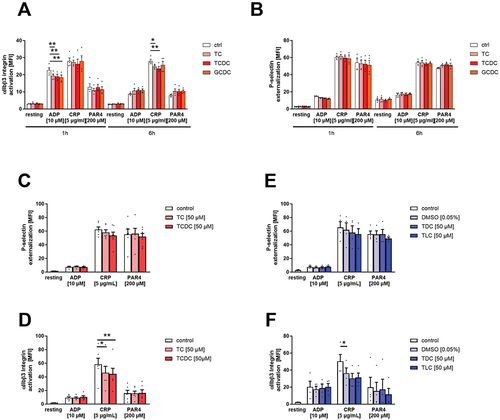
Figure 2. Bile acids inhibit human platelet adhesion and thrombus formation. Human platelets were isolated and 1 h after preincubation with hydrophilic (A-D) or hydrophobic (E-H) bile acids, isolated platelets were allowed to adhere on a fibrinogen matrix. (H+K) total adhesion (A+E) and spreading (C+G) was recorded after 60 min (n = 6). All images show platelet adhesion and spreading after 60 min. Human whole blood was preincubated with hydrophilic (I-K) or hydrophobic (M-L) bile acids and thrombus formation on a collagen matrix under arterial shear rate (1700−1) was analyzed with representative images (1700s−1; n = 3–5). Surface coverage and number of adherent cells was determined using Fiji software. Relative thrombus volume was determined as mean fluorescence intensity of fluorescently labeled platelets present in different thrombi. Spreaded platelets were classified in 4 different stages and counted. Statistical significance was determined by two-way ANOVA with Tukey’s multiple comparisons test. *p < .05, **p < .01, ***p < .001. Data shown as mean + SEM. CRP = collagen-related peptide, PAR4 = PAR4 activating peptide.
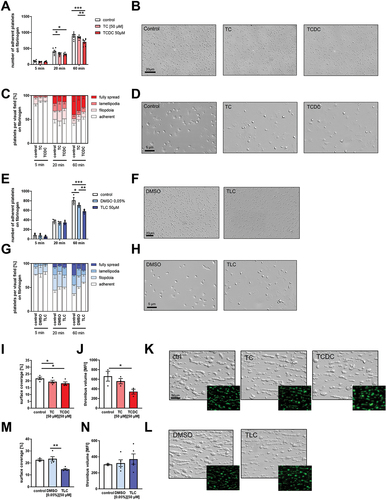
Figure 3. Effect of taurine conjugated bile acids on murine platelets. Serum samples of C57Bl6/J mice were analyzed regarding their specific bile acid profile (n = 5). (A) Total variation of conjugation state of the murine bile acid pool and (B) differentiated appearance of each bile acid in percent. Murine whole blood was preincubated for 1 h with TCDC (C+D, n = 8) or TLC with respective DMSO control (E+F, n = 4). Integrin αIIbβ3 activation after agonist stimulation was measured in flow cytometric analysis. Mean fluorescence intensity (MFI) in the platelet specific FSC/SSC gate was recorded. 1 h after preincubation with TCDC, TLC or DMSO control, isolated platelets were allowed to adhere on a fibrinogen matrix for 60 min and total adhesion was recorded (n = 3). Surface coverage and number of adherent cells was determined using Fiji software. Statistical significance was determined by student’s unpaired t-test. *p < .05, **p < .01, *p < .001. Data shown as mean + SEM. CRP = collagen-related peptide, PAR4 = PAR4 activating peptide, U46 (U46619) = thromboxane A2 analogue.
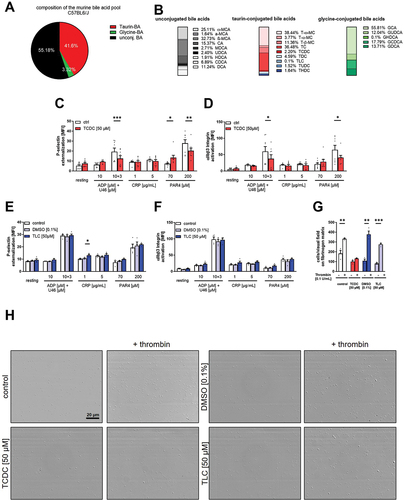
Figure 4. Platelets express the bile acid receptor TGR5. Human platelets lysates (40×106) were analyzed regarding their protein expression of TGR5 (A) with and without CRP stimulation. Lysates of human gallbladder tissue and TGR5 transfected HEK293 cells served as positive control. (B) Quantification of TGR5 expression in human platelets lysates (n = 3). (C) Human platelets were allowed to adhere on a fibrinogen matrix and were stained for TGR5 and Actin filaments (n = 3). (D) Analysis of cDNA isolated from murine platelets were analyzed regarding the expression of TGR5 mRNA (n = 3). (E) Murine platelets were allowed to adhere on a fibrinogen matrix and were stained for TGR5 and actin filaments (n = 3). (F) Murine platelets of wildtype and TGR5-/- mice were pre-incubated with TCDC, TLC or DMSO control for 1 h. After preincubation, platelets were allowed to adhere on a fibrinogen matrix for 60 min and total adhesion was recorded (n = 3–6). Surface coverage and number of adherent cells (E) was determined using Fiji software. Statistical significance was determined by two-way ANOVA with Tukey’s multiple comparisons test. *p < .05, *p < .001. Data shown as mean + SEM.
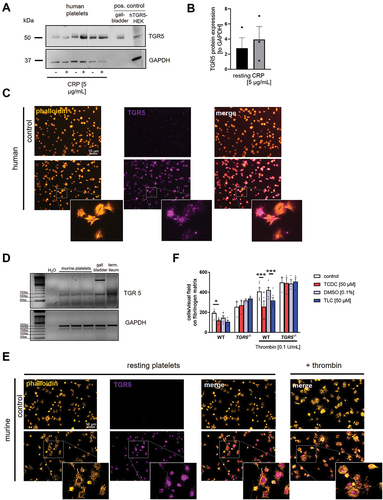
Figure 5. Genetic deficiency of TGR5 leads to increased platelet activation and thrombus formation. (A) platelet count and (B) mean platelet volume was measured by a hematology analyzer (n = 17). (C) Expression of indicated glycoproteins on the surface of platelets was measured via MFI in flow cytometric analysis in the platelet specific FSC/SSC gate (n = 7). For platelet activation analysis, (D) externalization of P-selectin and (E) activation of αIIbβ3 integrin on the platelet surface of WT and TGR5-/- platelets was recorded with indicated agonists (n = 10). Heparinized murine whole blood was observed regarding thrombus formation on a collagen matrix under arterial shear rates. Surface coverage (F) and thrombus size were calculated with (H) representative images (n = 3–5). Surface coverage and thrombus size was determined via detection of the fluorescent signal using Fiji software. (I-K) isolated murine platelets (20×106) were stimulated with indicated agonists and analyzed for the phosphorylation of AKT and ERK 1/2 in TGR5-/- platelets after stimulation with ADP or thrombin (n = 3). Phosphorylation state of (J) ERK1/2 and (K) AKT was analyzed by normalizing the specific relative density signal to the loading control GAPDH. Statistical significance was determined by unpaired student’s t-test. *p < .05, **p < .01, *p < .001. Data shown as mean + SEM. CRP = collagen-related peptide, thr. = thrombin.
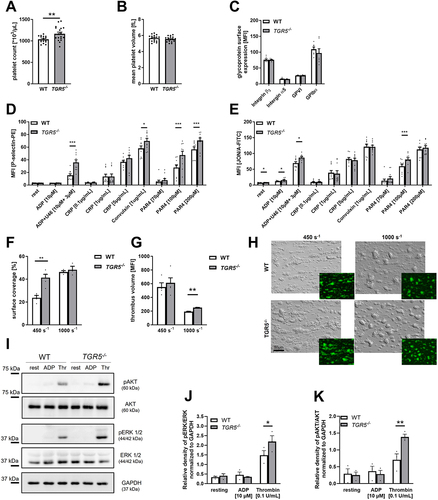
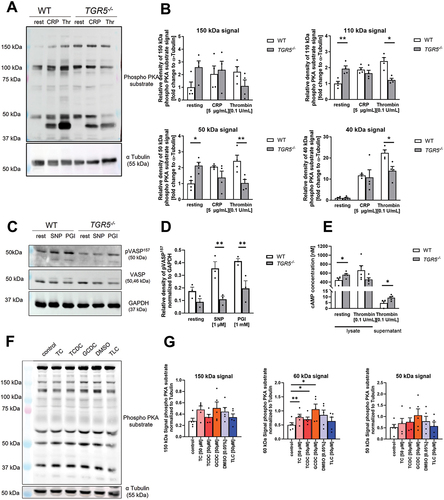
Figure 6. Dysregulated phosphorylation of PKA and VASP in TGR5 deficient platelets and after bile acids stimulation is responsible for altered platelet activation. (A-E) isolated murine platelets (20 × 106) were stimulated with indicated agonists and analyzed for the phosphorylation of PKA substrates and VASP. (A) Analysis of PKA substrate phosphorylation after stimulation with collagen related peptide (CRP) or thrombin (thr) (n = 4). (B) Analysis of different phosphorylation substrates of PKA that were differentiated by their molecular weight. (C-D) analysis of VASP phosphorylation at Ser157 after stimulation with sodium nitroprusside (SNP; 5 µM, 5 min) or PGI (prostaglandin; 1 µM, 5 min). (E) Analysis of cAMP levels in platelet lysates and in the supernatant of thrombin stimulated platelets isolated from WT and TGR5-/- mice (n = 4–5). (F) Isolated human platelets (20 × 106) were incubated with indicated bile acid (50 µM) or DMSO (0.05%, control for TLC) for 1 h, and phospo-PKA substrate phosphorylation was analyzed. (G) Analysis of different phosphorylation substrates of PKA that were differentiated by their molecular weight (n = 5). Depicted are mean values + SEM; *p < .05, **p < .01 using two-way ANOVA followed by Sidak’s multiple comparison test (A-E) and RM one-way ANOVA with holm-Sidak multiple comparison (G).