Figures & data
Figure 1. Joint histograms of three pairs of filters calculated from different sets of images. Each row displays the histograms of one pair of filters. These three pairs of filters differ in their relative distances with increasing distance from the upper to the lower row. Each column displays the histograms calculated using images of different categories (refer to text).
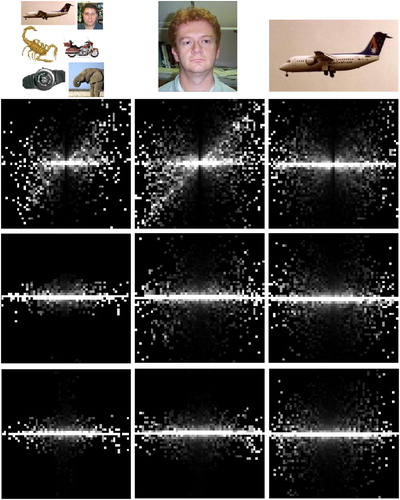
Figure 2. The proposed model is composed of three layers connected in a hierarchical manner. Neurons in each layer receive their input from both the previous layer neurons and neighbouring neurons in the same layer. Bottom-up RF sizes are expressed in image pixels for each layer.
Table 1. Model parameters.
Figure 3. A set of horizontal connections learned by four V1 neurons of the proposed model using the learning rule of EquationEquation (7). The preferred direction of each neuron is displayed as a red bar in the centre of each picture. These weights are very similar to the pattern of horizontal weights observed in visual area V1.
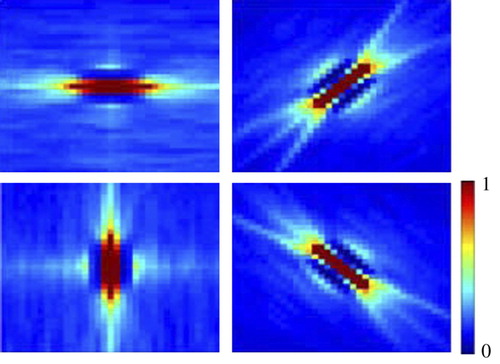
Figure 4. Responses of three model neurons to the stimulus set used by Hedge and Hoyer. The first row displays the responses of a neuron selective to contour stimuli. The second row is responses of a neuron selective to gratings. Responses in the third row depict a neuron with no specific selectivity to stimuli. These three types of neuron were observed in macaque visual area V2 (Hedgé and Van Essen 2003).
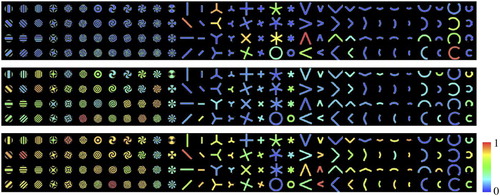
Figure 5. (a) Set of angles used by Ito and Komatsu to probe the selectivity of macaque V2 neurons. (b, c) Response of two model V2 neurons to this stimulus set. The neuron in (b) is tuned to a sharp angle, while the neuron in (c) is most activated by a straight 0° half line.
Figure 6. Neurons in area V2 of the proposed model prefer object contours over textures in natural images. The leftmost column is the input image to the model. The middle column is the activity of model V1 neurons before feedback from area V2. The right column is the activity of V1 neurons after being modulated by feedback signals from model area V2.
Figure 7. Responses of two model V4 neurons to the stimulus set in Pasupathy and Connor Citation(1999). (a) This neuron is evoked strongly by a sharp convex element at the left of the shape centre. (b) Strongest responses for this neuron are to the shapes that have two sharp convex projections at 90° and 235° in the object centre coordinates.
Figure 8. Invariance property of responses of the neuron in to spatial changes of (a) the optimal and (b) the suboptimal stimulus. The receptive field of this neuron is divided into a 5×5 grid and the stimulus is presented in each location to the neuron. The strength of response in each location is indicated by the brightness of its corresponding circle.
Figure 9. Six objects used to test the recognition rates of the proposed model.
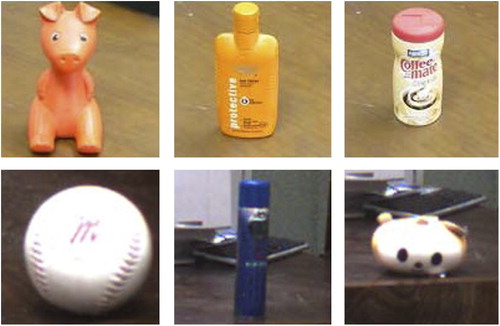
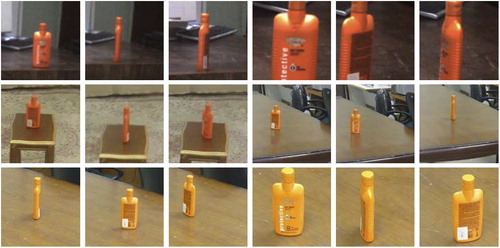
Figure 10. Sample images of an object used to test the recognition rates of the proposed model.