
Figures & data
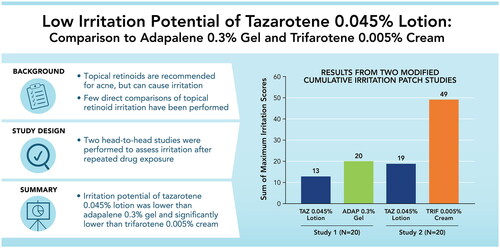
Figure 1. Study Design. Patches were placed on participants’ backs in randomized order.
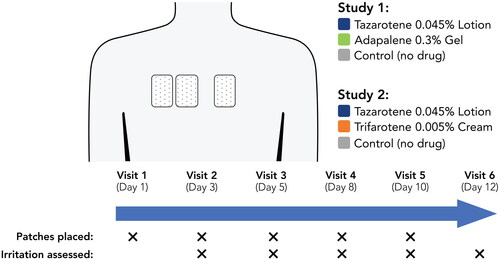
Table 1. Assessments of Irritation.
Figure 2. Irritation Potential of Adapalene 0.3% Gel Versus Tazarotene 0.045% Lotion (Study 1). Means, standard deviations, and p-values at all study visits are presented in Supplemental Table 1. Patches were applied at visits 1–5 after any skin assessments were made. Visits 1–6 correspond to study days 1, 3, 5, 8, 10, and 12, respectively. Filled symbols represent the overall study population (N = 20); open symbols represent participants with acne (n = 9). There were no statistically significant differences between adapalene 0.3% gel and tazarotene 0.045% lotion at any study visit. For adapalene 0.3% gel, Dermal Effect scores were significantly greater vs control at visits 4–6 for both the overall and acne-only study populations. For tazarotene 0.045% lotion, Dermal Effects scores were significantly greater vs control at visits 4–6 for the overall study population, and at visit 5 for the acne-only population.
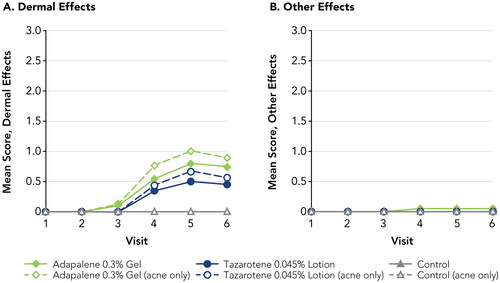
Figure 3. Participant Photographs at Final Assessment in Participants With Acne (Study 1; Visit 6; Day 12). Individual results may vary.
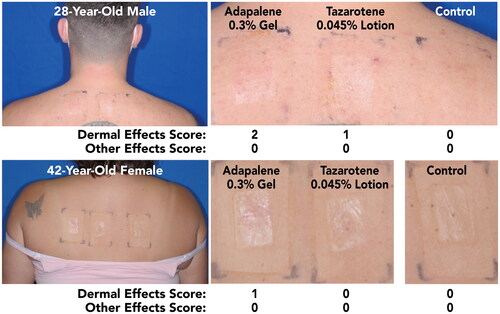
Figure 4. Irritation Potential of Trifarotene 0.005% Cream Versus Tazarotene 0.045% Lotion (Study 2). *p < 0.05, trifarotene 0.005% cream vs tazarotene 0.045% lotion, overall study population (N = 20; filled symbols). #p < 0.05, trifarotene 0.005% cream vs tazarotene 0.045% lotion, acne-only population (n = 7; open symbols). Means, standard deviations, and p-values at all study visits are presented in Supplemental Table 2. Patches were applied at visits 1–5 after any skin assessments were made. Visits 1–6 correspond to study days 1, 3, 5, 8, 10, and 12, respectively. For trifarotene 0.005% cream, Dermal Effects scores were significantly greater vs control at visits 2–6 for the overall study population and at visits 3–6 for the acne-only population; Other Effects scores were significantly greater vs control at visits 3–6 for the overall study population and at visits 5–6 for the acne-only population. For tazarotene 0.045% lotion, Dermal Effects scores were significantly greater vs control at visits 4–6 for both the overall and acne-only study populations; Other Effects scores were not significantly different from control at any study visit.
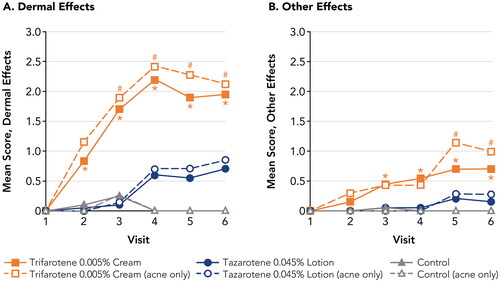
Figure 5. Participant Photographs at Final Assessment in Participants With Acne (Study 2; Visit 6; Day 12). Individual results may vary.
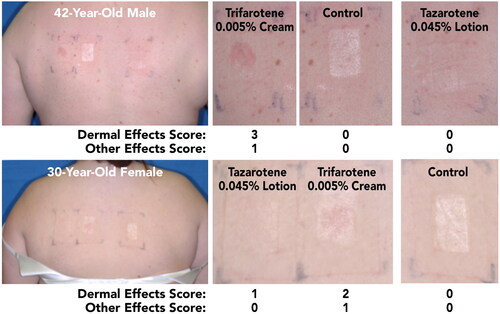
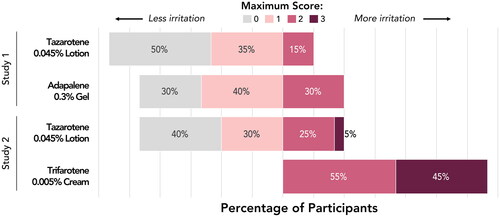
Figure 6. Maximum Irritation Scores (N = 20 each study). Maximum score indicates the highest Dermal Effects or Other Effects score that each participant experienced at any study visit.
Supplemental Material
Download PDF (77.5 KB)Data availability statement
Data are available upon request.