
Figures & data
Figure 1. (A) Preoperative design for tumescent injection and fat harvesting. (B) The serum is removed from the centrifuged fat, (C) creating the desired quantity (approximately 2 cc) of the stromal vascular fraction.
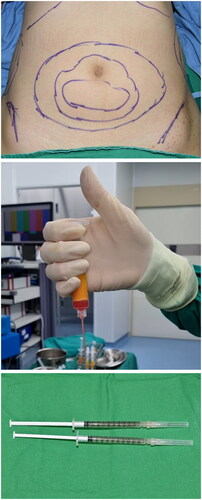
Table 1. The Patient and Observer Scar Assessment Scale (POSAS).
Table 2. Patient demographics.
Figure 2. Bar plots with error bars indicating the Observer Scar Assessment Scale.
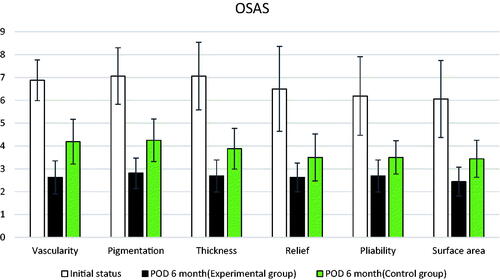
Figure 3. Bar plot with error bars showing the Patient Scar Assessment Scale.
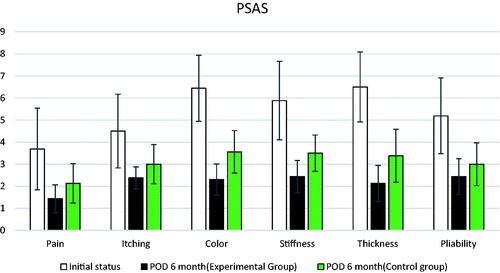
Figure 4. (A) A scar that occurred after trauma to the leg 6 years prior. (B) Immediate postoperative image. The yellow section is the control side and the red section is the experimental treatment side. (C) Six months postoperatively. The scar appears less visible on the experimental treatment side than on the control side.
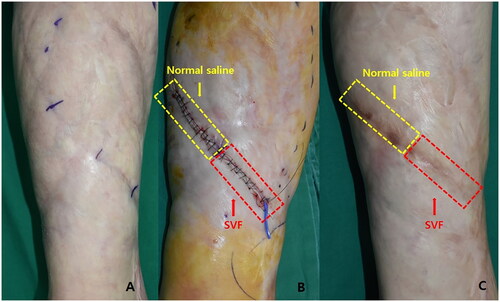
Figure 5. (A) Hypertrophic scar after Cesarean surgery 2 years prior. (B) Immediate postoperative image. The yellow section is the control side and the red section is the experimental treatment side. (C) Six months postoperatively. The scar appears less visible on the experimental treatment side than on the control side.
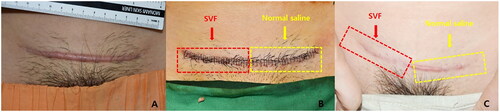
Table 3. Results of the POSAS scale comparing pre-and 6-months post-surgery.
Data availability statement
The participants of this study did not give written consent for their data to be shared publicly, so due to the sensitive nature of the research, supporting data is not available.