
Figures & data
Figure 1. Study design. *Index date is the date of the first biologic or oral prescription, which occurred between 1 January 2013 and 31 December 2017.
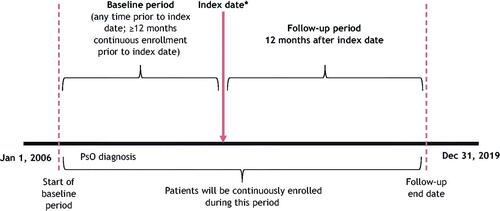
Table 1. Definition of dependent variables.
Table 2. Demographics and baseline characteristics of patients on oral systemic treatments for psoriasis.
Table 3. Demographics and baseline characteristics of patients on a biologic therapy.
Figure 2. Oral initiator cohort with 12 months of follow-up. A study design flow chart depicting numbers and percentages of patients included in the analysis population of the oral cohort with 12 months of follow-up. It is further broken down by nonswitchers, switchers (to orals and biologic therapies), and discontinuers. Rx: prescription.
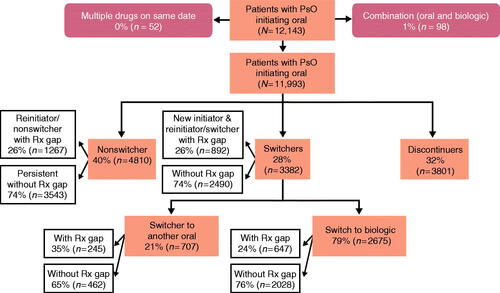
Figure 3. Treatment patterns after 1 year of oral treatment in the oral cohort. A bar graph of 1-year treatment patterns in the oral cohort. Treatments include apremilast, cyclosporine, methotrexate, and acitretin. Percentages are given for switchers, pure discontinuers, reinitiator/nonswitchers, and persistence within each treatment.
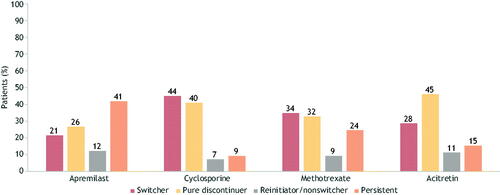
Figure 4. Treatment patterns of switching (with/without gap) in the oral cohort (LOT 1 – 2 – 3). A Sankey diagram showing median time to switch from first- to second- and third-line therapies in the oral cohort. LOT: line of therapy.
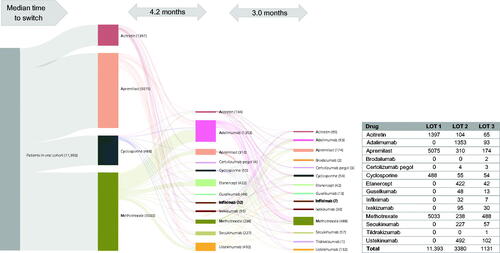
Figure 5. Biologic initiator cohort with 12 months of follow-up. A study design flow chart depicting numbers and percentages of patients included in the analysis population of the biologic cohort with 12 months of follow-up. It is further broken down by nonswitchers, switchers (to oral treatments and to biologic therapies), and discontinuers. Rx: prescription.
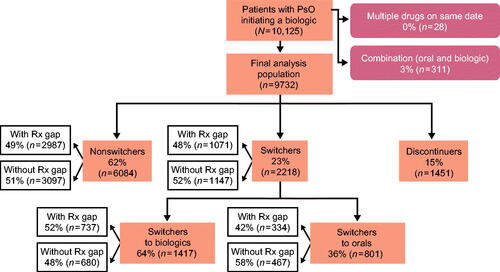
Figure 6. Treatment patterns after 1 year of select biologic treatment in the biologic cohort. A bar graph of 1-year treatment patterns in the biologic cohort. Treatments include adalimumab, etanercept, infliximab, ixekizumab, secukinumab, ustekinumab, and guselkumab. Percentages are given for switchers, pure discontinuers, reinitiator/nonswitchers, and persistence within each treatment.
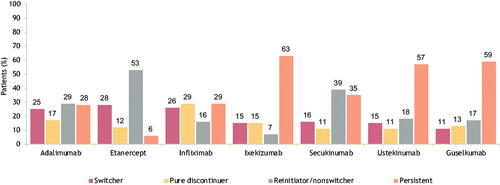
Figure 7. Treatment patterns of switching (with/without gap) in biologic cohort (LOT 1 – 2 – 3). A Sankey diagram showing median time to switch from first- to second- and third-line therapies among the biologic cohort. LOT, line of therapy.
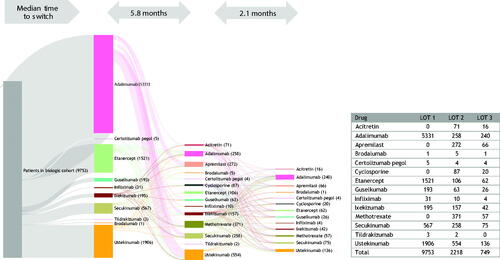
Figure 8. Kaplan–Meier (KM) curves for time to index treatment non-persistence with oral treatments (A) and biologic therapies (B). KM curves depict time to index treatment non-persistence (discontinuation or switch) for oral and biologic cohorts.
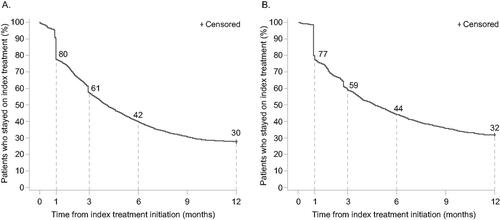
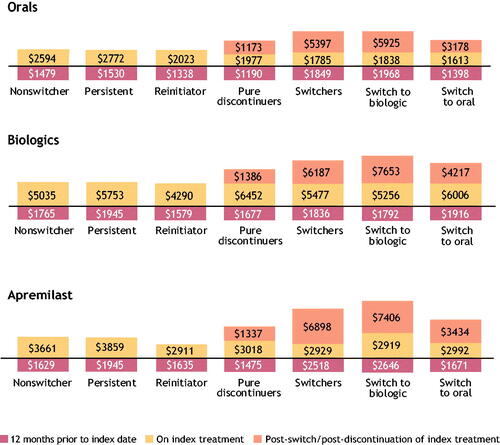
Figure 9. Cost analysis per-patient per-month per cohort level. A stacked bar chart depicting 12-month baseline costs, pre-switch, and post-switch/reinitiation/new initiation costs among nonswitchers, persistent, reinitiators, pure discontinuers, switchers, switch to biologic, and switch to oral treatment in the oral, biologic, and apremilast cohorts. Note: Per-patient per-month costs cannot be summed to estimate the total per-patient per-month cost of the 12-month treatment pattern.
Supplemental Material
Download PDF (243.7 KB)Data availability statement
The Bristol Myers Squibb policy on data sharing may be found at https://www.bms.com/researchers-and-partners/independent-research/data-sharing-request-process.html.