
Figures & data
Figure 1. Box plot showing differences between basal time and 6 weeks of ertapenem (end of treatment). (A) Median IHS4 dropped from 28 to 18 (p = 0.008). (B) Median VAS changed from 9 to 2 (p = 0.004).
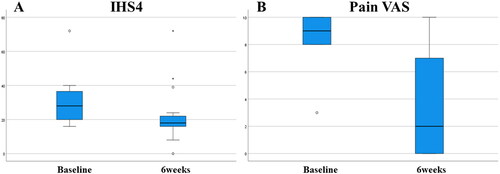
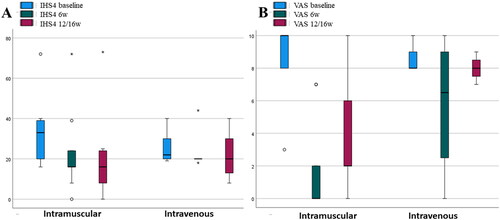
Figure 2. Box plot showing differences in favor of the intramuscular route in IHS4 and VAS. (A) Median IHS 4 dropped from 33 to 16 at 6 weeks (p = 0.018) and remained at 12/16 weeks (p = 0.011). (B) Median VAS changed from 10 to 0 at 6 weeks (p = 0.0014) and subsequently increased to 2 at 12/16 weeks (p = 0.020).
Data availability statement
The data that support the findings are available from the corresponding author, APC, upon reasonable request.