
Figures & data
Figure 1. (a) Stacked bar chart SDM-Q-9 per item before and after introduction of the intervention. (b) Stacked bar chart SDM-Q-Doc per item before and after introduction of the intervention.
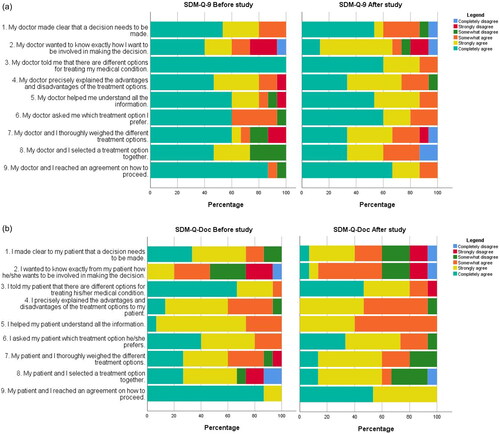
Table 1. Chosen treatment and effectiveness before-and-after study.
Data availability statement
Our data is available on request. Data will be shared with researchers who provide a methodologically sound proposal after execution of a data-sharing agreement.