
Figures & data
Figure 1. Percent of dermatologists who performed more destruction (including only destruction) or more excision (including only excision) for all NMSC. Dermatologist characteristics included geographic region, years of dermatology experience (quartiles), median household income of the practice zip code (quartiles), and rural-urban commuting area (RUCA) code. The percent of dermatologists who performed more destruction than excision (including only destruction) is shown on the left, in black, and the percent of dermatologists who performed more excision than destruction (including only excision) is shown on the right, in grey. Each stacked horizontal bar represents all dermatologists with the listed characteristic and sums to 100%. Odds ratios for performing more excision or more destruction were calculated relative to the reference group, with statistically significant differences noted. Ref: reference group; ns: not significant, * p < .05, ** p < .01, and *** p < .001.
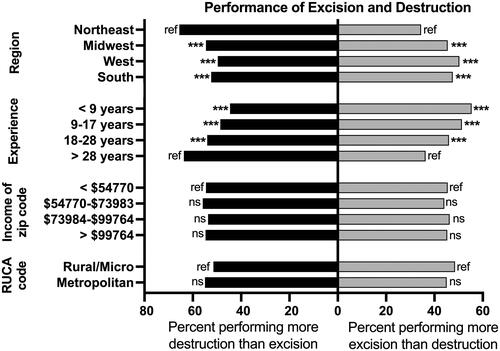
Figure 2. Percent of dermatologists who performed only destructions or only excisions, which we defined as outliers, by covariate. Dermatologist characteristics included geographic region, years of dermatology experience (quartiles), median household income of the practice zip code (quartiles), and rural-urban commuting area (RUCA) code. The percent of destruction outlier dermatologists is shown on the left, in black, and the percent of excision outlier dermatologists is shown on the right, in grey. Each stacked horizontal bar represents the dermatologists performing only excision or only destruction with the listed characteristic. Odds ratios for performing only excision or only destruction were calculated relative to the reference group, with statistically significant differences noted. Ref: reference group; ns: not significant, * p < .05, ** p < .01, and *** p < .001.
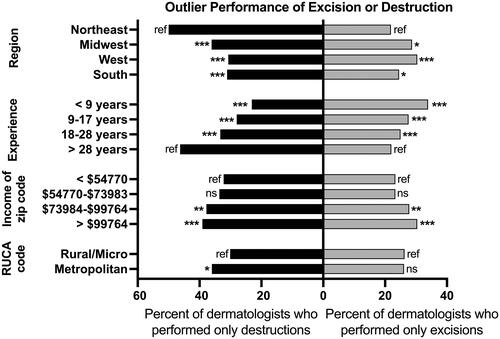
Figure 3. Association between the mean proportion of services for excision and year of dermatology experience. Scatter plot and linear fit association between the years of experience that represented at least 10 dermatologists and the mean proportion of malignant excisions out of the sum of malignant excisions and malignant destructions. Dashed lines represent 95% confidence interval for linear regression.
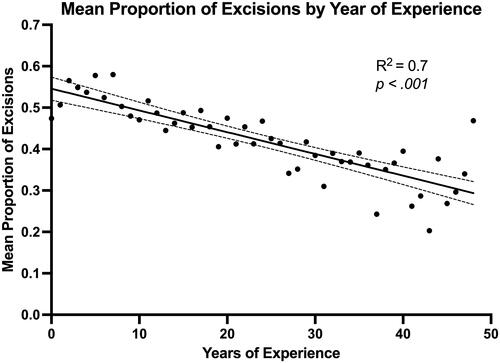
Table 1. Percent of dermatologists by experience who performed only destructions or only excisions, which we defined as outliers, for ‘low risk’ NMSC.
Supplemental Material
Download Zip (145.9 KB)Data availability statement
The data that support the findings of this study are openly available in Data.CMS.gov ‘Medicare Physician & Other Practitioners - by Provider’ at https://data.cms.gov/provider-summary-by-type-of-service/medicare-physician-other-practitioners, reference number 24.