
Figures & data
Table 1. Adverse events.
Table 2. Patient characteristics at baseline (n = 149).
Table 3. Outcome measures and dupilumab serum concentrations at baseline and during follow-up.
Figure 1. (A) Dupilumab serum levels over time. Dot plot of the dupilumab levels at different time points (with mean and SDs in red). (B) The ratio of dupilumab serum levels. Dot plot of the ratios of the dupilumab levels at different time points (with mean and SDs in red), which approach 1 (i.e., the concentrations are similar over time).
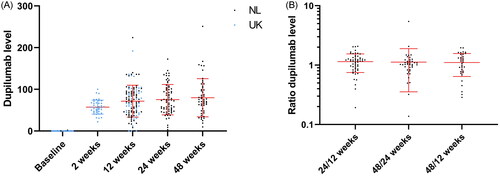
Figure 2. (A) The concentration-effect curve for dupilumab level and ΔEASI at 24 weeks. A concentration-effect curve showing the dupilumab serum level in μg/mL at 24 weeks on the x-axis and correlating ΔEASI at 24 weeks (versus baseline) on the y-axis. All patients were sorted from low to high drug concentration, with each dot representing the mean concentration with SDs and correlating ΔEASI for 10 patients (last group 9 patients). (B) The concentration-effect curve for dupilumab level and ΔEASI at 12 weeks. The concentration-effect curve showing the dupilumab serum level in μg/mL at 12 weeks on the x-axis and correlating ΔEASI at 12 weeks (versus baseline) on the y-axis. All patients were sorted from low to high drug concentration, with each dot representing the mean concentration with SDs and correlating ΔEASI for 10 patients (last group 11 patients).
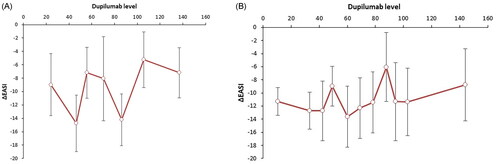
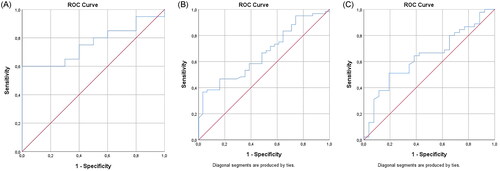
Figure 3. (A) ROC curve for patients reaching EASI ≤ 7 at 24 weeks of treatment and dupilumab serum level at 2 weeks. The AUC in the ROC curve is not significantly different from 0.5, indicating that dupilumab concentration does not have the ability to distinguish between the group that reached EASI ≤ 7 (AUC 0.760, 95% CI: 0.591–0.929, p = .022). At 64.1 μg/mL, a sensitivity of 60% and a specificity of 100% was found. (B) ROC curve for patients reaching EASI ≤ 7 at 24 weeks of treatment and dupilumab serum level at 12 weeks. The AUC in the ROC curve is significantly different from 0.5, indicating that the dupilumab concentration has the ability to distinguish the group that reached EASI ≤ 7 (AUC 0.664, 95% CI: 0.552–0.777, p = .011). At 32.7μg/mL, a sensitivity of 95% and a specificity of 26% was found. (C) ROC curve for patients reaching EASI ≤ 7 at 24 weeks of treatment and dupilumab serum level at 24 weeks. The AUC in the ROC curve is not significantly different from 0.5, indicating that dupilumab concentration does not have the ability to distinguish between the group that reached EASI ≤ 7 (AUC 0.638, p = .053, borderline significant). At 59.6μg/mL, a sensitivity of 67% and a specificity of 58% was found for EASI ≤ 7.
Supplemental Material
Download Zip (46.1 KB)Data availability statement
The authors confirm that the data supporting the findings of this study are available within the article and its supplementary materials.