
Figures & data
Table 1. Characteristics of the study cohort.
Figure 1. Distribution of the scores in each Treatment Satisfaction Questionnaire for Medication (TSQM) domain.
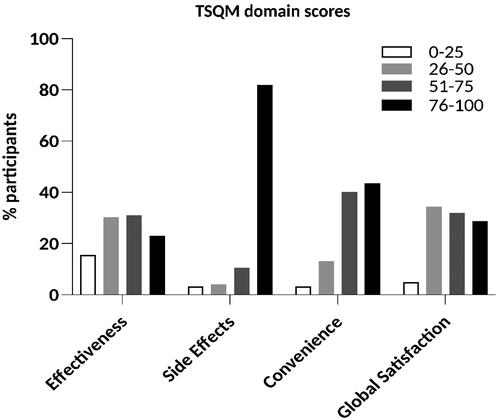
Figure 2. Associations between TSQM scores and age, sex and partnership. (a) Higher age was associated with higher convenience scores (PC: 0.24; p = .007). (b) No significant differences were found with respect to sex. (c) Participants living with a partner scored higher in the side effects (93.8 vs. 83.7, p = .007) and convenience (78.7 vs. 63.2, p < .001) domains. Bars: PC (a) or means with standard deviations (b, c). PC: Pearson’s correlation coefficient. *p < .05, **p < .01, and ***p < .001.
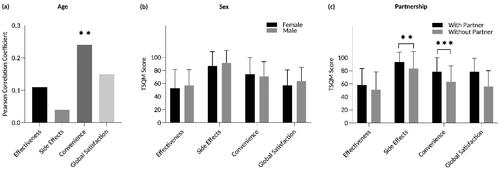
Figure 3. Associations between TSQM scores and PASI and DLQI. (a) There were no significant correlations between PASI and any of the four TSQM domains. (b) DLQI scores and the TSQM domains convenience (PC: –0.37; p < .001) and global satisfaction (PC: –0.20; p = .022) correlated inversely. Bars: PC. DLQI: Dermatology Life Quality Index; PASI: Psoriasis Area and Severity Index; PC: Pearson’s correlation coefficient. *p < .05 and ***p < .001.
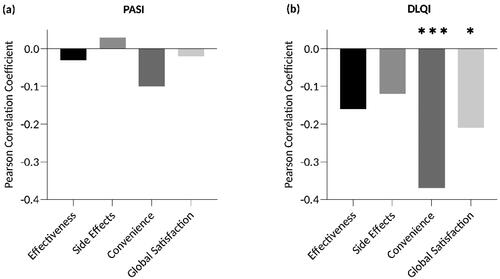
Figure 4. Associations between TSQM scores and the ability to apply topical therapy independently, pruritus and sole or adjunctive use of topical treatment. Satisfaction with convenience was significantly higher when patients were able to apply topical therapy independently (75.5 vs. 54.8, p = .002; (a)) and when pruritus was absent (67.6 vs. 79.9, p = .005; (b)). (c) Global satisfaction was higher in patients who used topicals as adjunctive therapy (50.7 vs. 65.7, p = .002). Bars: means with standard deviations. **p < .01.
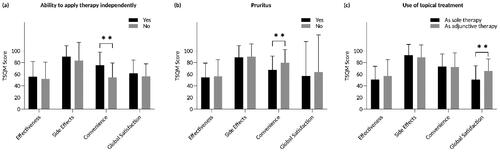
Table 2. Multiple linear regression models showing associations of participants’ characteristics with treatment satisfaction with the currently prescribed topical treatment.
Figure 5. Satisfaction with specific topical medications. (a) Higher scores in the effectiveness domain were found for the combination therapy of TCS and VDA compared to TCS monotherapy (mean: 69.1 vs. 51.9, median: 67.0 vs. 50.0, p = .027), VDA monotherapy (mean: 69.1 vs. 53.8, median: 67.0 vs. 56.0, p = .047), urea (mean: 69.1 vs. 44.8, median: 67.0 vs. 47.0, p = .005), and salicylic acid (mean: 69.1 vs. 33.3, median: 67.0 vs. 28.0, p < .001). Treatment with VDA monotherapy (mean: 53.8 vs. 33.3, median: 56.0 vs. 28.0, p = .044) or anthralin (mean: 61.9 vs. 33.3, median: 67.0 vs. 28.0, p = .005) was associated with higher satisfaction scores in the effectiveness domain compared to salicylic acid therapy. Furthermore, patients treated with anthralin were more satisfied with the effectiveness than those treated with urea (mean: 61.9 vs. 44.8, median: 67.0 vs. 47.0, p = .030). (b) The combination of TCS and VDA was associated with a higher mean score in the side effects domain than salicylic acid (mean: 96.9 vs. 66.4, median: 100.0 vs. 66.0, p < .001). (c) Patients with VDA monotherapy scored significantly higher in the convenience domain compared to those with anthralin therapy (mean: 82.0 vs. 59.7, median: 83.0 vs. 67.0, p < .001). (d) No statistically significant differences between agents were detected in the global satisfaction domain. The box bounds the interquartile range (upper quartile–lower quartile) divided by the median (horizontal line) and whiskers extend to the minimum and maximum of the data values. The cross (+) indicates the mean value. TCS: topical corticosteroids; VDA: vitamin D analogues; TCS + VDA: fixed combination of TCS and VDA. *p < .05, **p < .01, and ***p < .001.
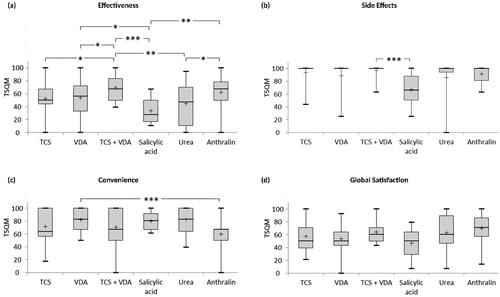
Table 3. Kind of current topical therapy.
Data availability statement
The data that support the findings of this study are available from the corresponding author upon reasonable request.