
Figures & data
Table 1. Demographics and baseline characteristics of the ITT population.
Figure 1. Change from baseline in total PGWBI scores through Week 28 in patients treated with tildrakizumab. Data are shown as the mean for the intention-to-treat population; error bars represent the standard deviation. *p < .05; **p < .01. BL: baseline; PGWBI: Psychological General Well-Being Index; SD: standard deviation.
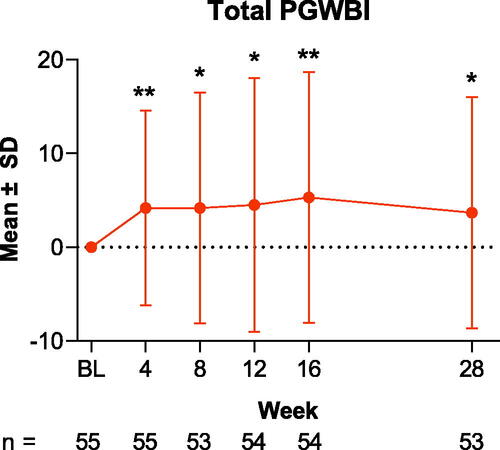
Figure 2. Change from baseline in PGWBI domain scores through Week 28 in patients treated with tildrakizumab. Results are shown for PGWBI domains (A) positive well-being, (B) general health, (C) anxiety, and (D) vitality. Data are presented as the mean for the intention-to-treat population; error bars represent the standard deviation. *p < .05; **p < .01; ***p < .001. BL: baseline; PGWBI: Psychological General Well-Being Index; SD: standard deviation.
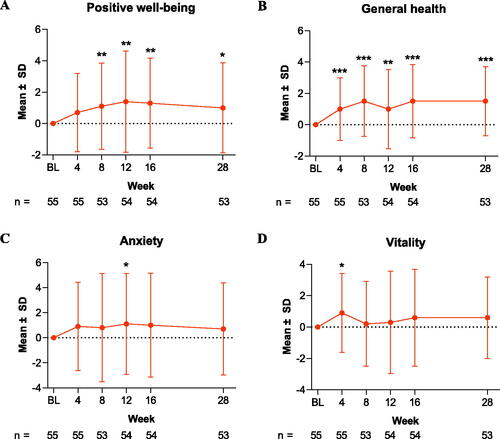
Figure 3. Change from baseline in (A) PGWBI depressed mood and (B) self-control scores through Week 28 in patients treated with tildrakizumab. Data are shown as the mean for the intention-to-treat population for PGWBI domains (A) depressed mood and (B) self-control. Error bars represent the standard deviation. *p < .05. BL: baseline; PGWBI: Psychological General Well-Being Index; SD: standard deviation.
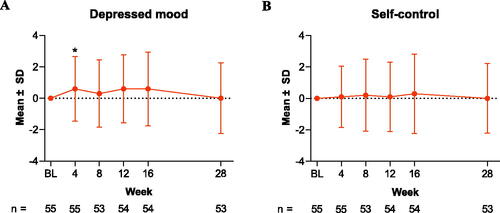
Figure 4. DLQI scores in patients treated with tildrakizumab. (A) Mean DLQI scores through Week 28 of treatment are presented. (B) Proportions of patients (n/N [%]) with a DLQI score of 0/1, a DLQI score of ≤5, or a ≥5-point reduction in DLQI score from baseline at Week 28 are shown. Panel A, *p < .001. Data are from the intention-to-treat population. Per (A), statistical significance was calculated per change from baseline. BL: baseline; DLQI: Dermatology Life Quality Index; SD: standard deviation.
![Figure 4. DLQI scores in patients treated with tildrakizumab. (A) Mean DLQI scores through Week 28 of treatment are presented. (B) Proportions of patients (n/N [%]) with a DLQI score of 0/1, a DLQI score of ≤5, or a ≥5-point reduction in DLQI score from baseline at Week 28 are shown. Panel A, *p < .001. Data are from the intention-to-treat population. Per (A), statistical significance was calculated per change from baseline. BL: baseline; DLQI: Dermatology Life Quality Index; SD: standard deviation.](/cms/asset/d6d893e7-d6ba-464d-a90c-9f50080021c2/ijdt_a_2200872_f0004_c.jpg)
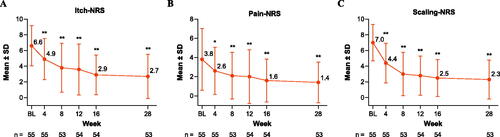
Figure 5. NRS scores in patients treated with tildrakizumab. Mean ± SD (A) Itch-NRS, (B) Pain-NRS, and (C) Scaling-NRS scores through Week 28. Data are from the intention-to-treat population. Missing data were not imputed; error bars represent the SD. *p < .05, **p < .001. Statistically significant change from baseline based on Student’s t-test. BL: baseline; NRS: Numerical Rating Scale; SD: standard deviation.
Supplemental Material
Download PDF (133.5 KB)Data availability statement
Data and other documents will be made available after publication, with no end date, to anyone who submits a reasonable request to the study sponsor.