
Figures & data
Table 1. Attributes and levels included in the discrete-choice experiment.
Figure 1. Example discrete-choice experiment question.
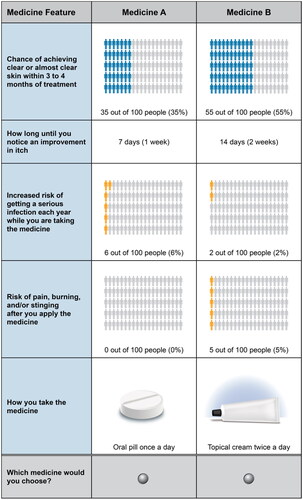
Table 2. Characteristics of the respondents (N = 300).
Figure 2. Attribute preference weights (N = 300). DCE = discrete-choice experiment. Attributes are presented in the order in which they appeared in the DCE questions. The change in utility associated with the difference between 2 levels of a given attribute is represented by the difference between the preference weights for those attribute levels. Larger differences between preference weights indicate that respondents viewed the change as having a relatively greater effect on overall utility or having greater relative importance in treatment choice. The vertical bars around each mean preference weight represent the 95% confidence interval around the point estimate.
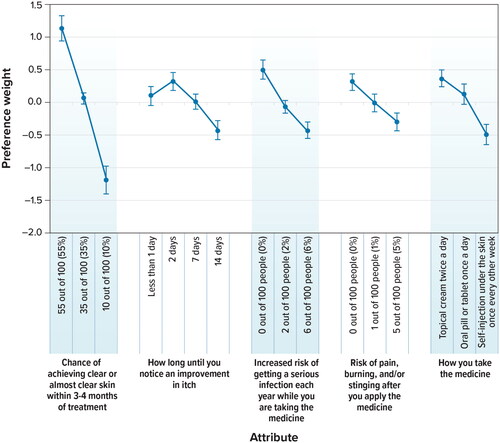
Figure 3. Conditional relative attribute importance (N = 300). DCE: discrete-choice experiment. Note: The conditional relative importance is the difference between the preference weights on the most influential attribute level and the least influential attribute level. These differences are summed across attributes, and the sum is scaled to 100. The conditional importance of each attribute is a percentage of this total. The vertical bars surrounding each relative importance weight estimate denote the 95% confidence interval (computed by the delta method). Attributes are presented in the order in which they appeared in the DCE questions.
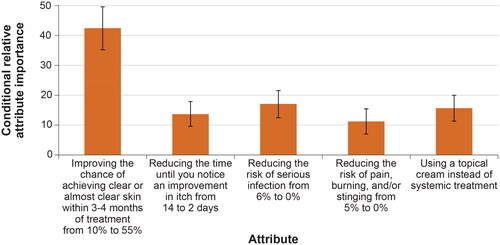
Table 3. Maximum acceptable risk calculations (N = 300).
Figure 4. Attribute preference weights: disease burden subgroups (N = 300). DCE: discrete-choice experiment. Note: Attributes are presented in the order in which they appeared in the DCE questions. The change in utility associated with the difference between 2 levels of a given attribute is represented by the difference between the preference weights for those attribute levels. Larger differences between preference weights indicate that respondents viewed the change as having a relatively greater effect on overall utility or having greater relative importance in treatment choice. The vertical bars around each mean preference weight represent the 95% confidence interval around the point estimate.
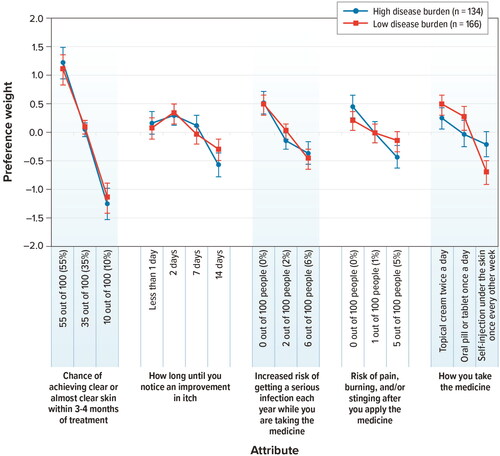
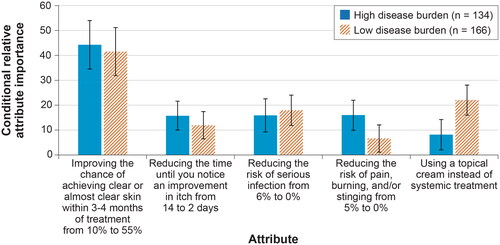
Figure 5. Conditional relative attribute importance: disease burden subgroup (N = 300). DCE: discrete-choice experiment. The conditional relative importance is the difference between the preference weights on the most influential attribute level and the least influential attribute level. These differences are summed across attributes, and the sum is scaled to 100. The conditional importance of each attribute is a percentage of this total. The vertical bars surrounding each relative importance weight estimate denote the 95% confidence interval (computed by the delta method). Attributes are presented in the order in which they appeared in the DCE questions.
ijdt_a_2215356_sm3025.pdf
Download PDF (207.7 KB)Data availability statement
Access to individual patient-level data is not available for this study. Information on Incyte’s clinical trial data sharing policy and instructions for submitting clinical trial data requests are available at: https://www.incyte.com/Portals/0/Assets/Compliance%20and%20Transparency/clinical-trial-data-sharing.pdf?ver=2020-05-21-132838-960