
Figures & data
Table 1. Rating grade for investigator global assessment score.
Table 2. Rating grade for clinical erythema assessment scale.
Table 3. Rating grade for patient satisfaction.
Figure 1. Clinical outcomes of patients with dupilumab facial redness treated with adipose-derived stem cell exosome. Change in average investigator global assessment (IGA), clinical erythema assessment (CEA), and patient satisfaction score over time. The average IGA score decreased from week 2 and continued to decrease until week 12. The average CEA score decreased significantly from the first week after the first exosome treatment. Overall, 19 out of 20 (95%) patients had a subjective satisfaction score of 4 (satisfied) at least once during the entire clinical trial period. *p < 0.05, **<0.01, ***<0.001, compared with baseline.
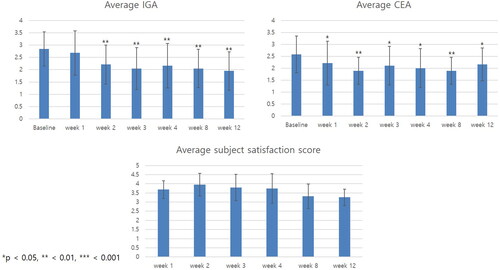
Figure 2. Representative clinical photographs of patients. Photographs were taken at baseline, at week 2 (after the first treatment), and week 12 (eight weeks after final the treatment). After exosome treatment, clinical improvements of erythema on the both cheeks, forehead, and chin were noted.
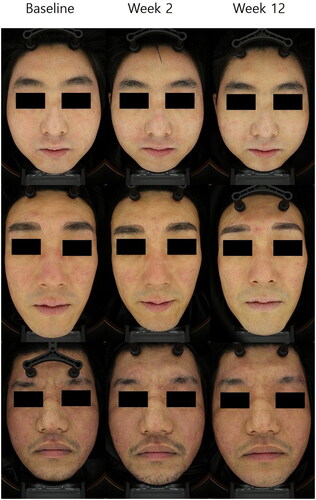
Figure 3. Changes in the erythema index (EI) were measured at four different anatomical locations on the face (forehead, left and right cheek, and chin). Erythema index (EI) decreased in all four areas after exosome treatment and decreased fastest on the forehead. *p < 0.05, **<0.01, ***<0.001, compared with baseline
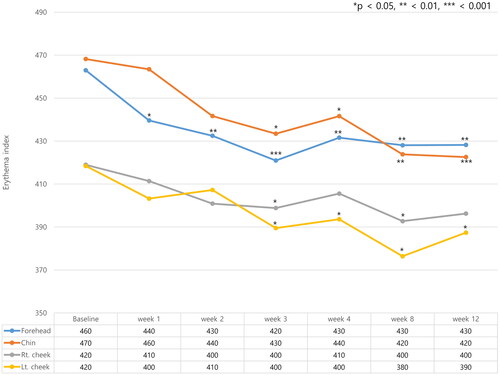
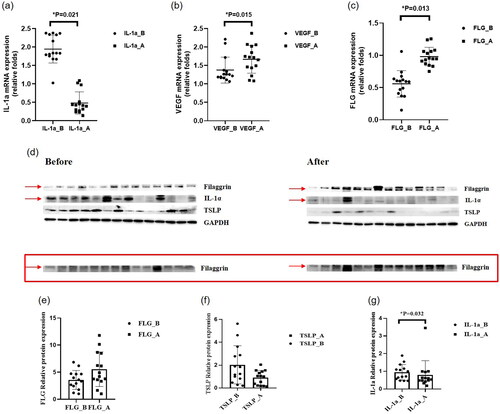
Figure 4. Results of the analysis of stratum corneum samples. (a) mRNA expression of interleukin-1α (IL-1α). The mRNA expression of IL-1α decreased in SC samples collected at week 8 compared with the baseline. (b) mRNA expression of vascular endothelial growth factor (VEGF). The mRNA expression of VEGF increased in SC samples collected at week 8 compared with the baseline. (c) mRNA expression of filaggrin (FLG). The mRNA expression of FLG increased in SC samples collected at week 8 compared with the baseline. (d) Western blot analysis. (e) Protein expression of filaggrin (FLG). The protein expression of FLG increased in SC samples collected at week 8 compared with the baseline. (f) Protein expression of human thymic stromal lymphopoietin (TSLP). The protein expression of TSLP decreased in SC samples collected at week 8 compared with the baseline. (g) Protein expression of interleukin-1α (IL-1α). The protein expression of IL-1α decreased in SC samples collected at week 8 compared with the baseline.
Supplemental Material
Download PDF (291.5 KB)Data availability statement
The data used to support the findings of this study are available from the corresponding author upon request.