
Figures & data
Figure 1. Macrophages accumulated in psoriatic skin. (A, B) CD68+ cells in the skin of normal subjects and psoriasis patients. (C, D) CD68+ cells in normal and IMQ-induced psoriasis-like mice skin. **p < 0.01 versus the normal group.
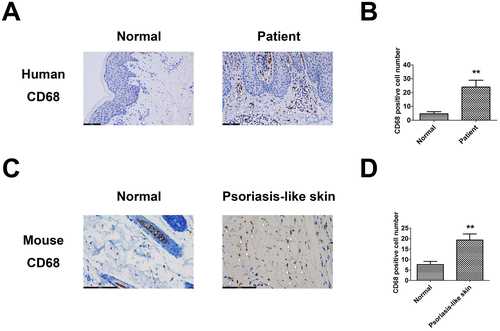
Figure 2. Fabrication and characterization of engineered EVs. (A) Schematic diagram illustration of the fabrication procedures of engineered EVs. (B, C) Expression levels of ANXA1 protein in infected Jurkat and EL4 T cells. (D, E) Optimization of manufacturing procedures for engineered EVs with macrophage membrane fusion. (F, G) Stability assessment of EVs. (H) Zeta potentials of original EVs, engineered EVs, and M2 macrophage membrane. (I) TEM photos of engineered EVs. **p < 0.01 versus the normal group.
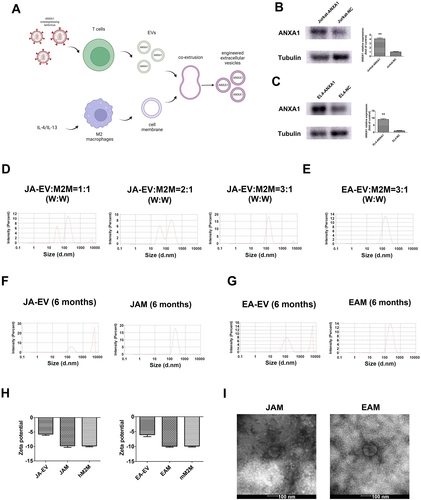
Figure 3. Cellular uptake and endocytic mechanism of EVs by macrophages. (A, B) Macrophages were incubated with Dil-labeled EVs at indicated concentrations. *p < 0.05, **p < 0.01 versus JC-EV group. #p < 0.05 versus JA-EV group. (C, D) Macrophages were treated with DMA, genistein, or sucrose before incubating with Dil-labeled EVs. *p < 0.05, **p < 0.01 versus the control group.
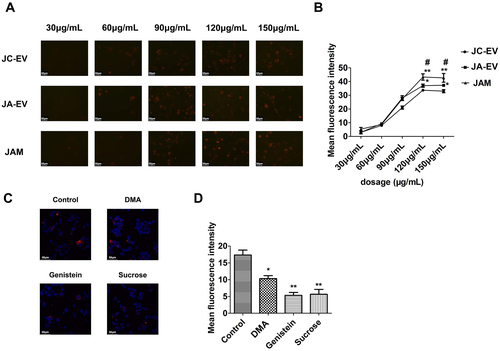
Figure 4. JAM reprogramed macrophages into M2 phenotype in vitro. (A) The relative mRNA levels of CD86, NOS2, IL-6, and TGFB1 in each group were measured by RT-PCR. (B) The number of viable macrophages was determined by CCK8 assay after incubating with EVs. *p < 0.05, **p < 0.01, ***p < 0.001 versus the control group. #p < 0.05, ##p < 0.01 versus JC-EV group. §p < 0.05 versus JA-EV group.
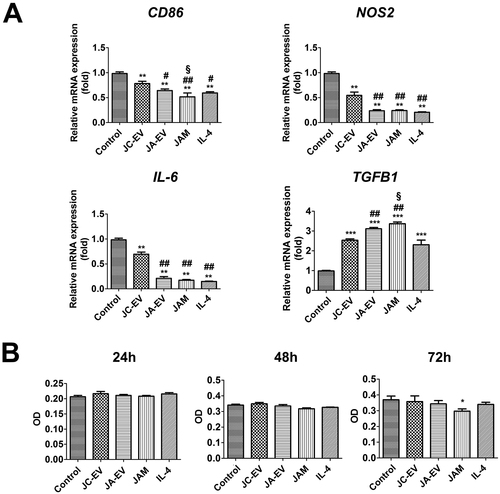
Figure 5. EAM ameliorated psoriasis-like skin inflammation in mice. (A) Experimental design for EV treatment in psoriasis-like mice. (B) Representative photos of mice and spleen after treatment. (C) PASI score. (D) H&E staining of the lesion in each group. (E) IHC staining for CD68. (F) IHC staining for Arg-1. (G) IHC staining for IL-1β. (H) IHC staining for IL-6. (I) IHC staining for TNF-α. (J) IHC staining for IL-17A. *p < 0.05, **p < 0.01 versus the control group. #p < 0.05, ##p < 0.01 versus PBS group. §p < 0.05, §§p < 0.01 versus EC-EV group. &p < 0.05 versus EA-EV group.
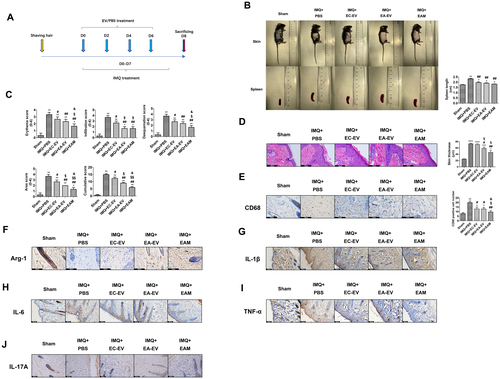
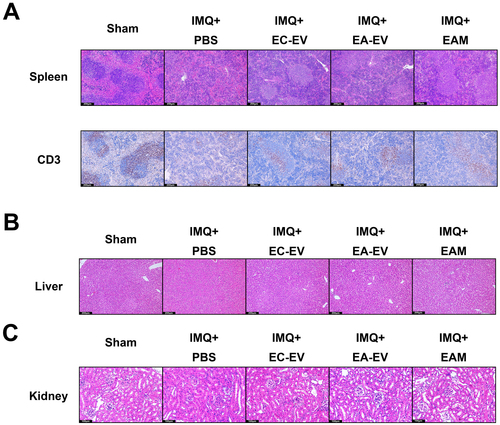
Figure 6. Effects of EV treatment on major organs in the psoriasis-like mouse model. (A) H&E and CD3 IHC staining of the spleen. (B) H&E staining of the liver. (C) H&E staining of the kidney.
Supplemental Material
Download Zip (3.5 MB)Data availability statement
Data will be made available on reasonable request.