
Figures & data
Table 1. Composition of Rilastil Difesa sterile® cream.
Figure 1. Flow chart of RCT design.
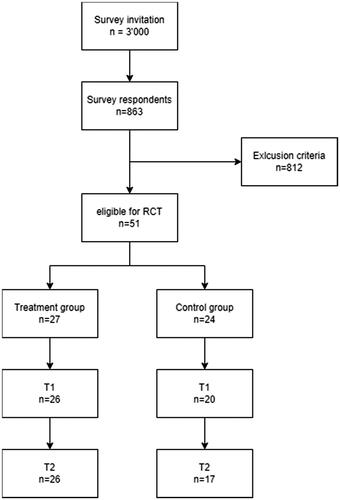
Table 2. Demographical and clinical data of subjects enrolled in RCT, separately for treatment group.
Figure 2. Graphical representation of Measure of HECSI, DLQI and QOLHEQ for non-treated and treated subjects at T0, T1, T2. For HECSI, to better visualized the data we do not show the three data that were higher than 100 (outlier values): 2 for non-treated T0 and one for non-treated T1.
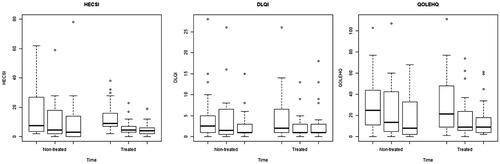
Table 3. Difference of median [IQR] values of dermatologic indices separated for non-treated and treated.
Figure 3. Three patients treated with Rilastil Difesa sterile®. improvement of erythema and scaling during the two months of treatment.
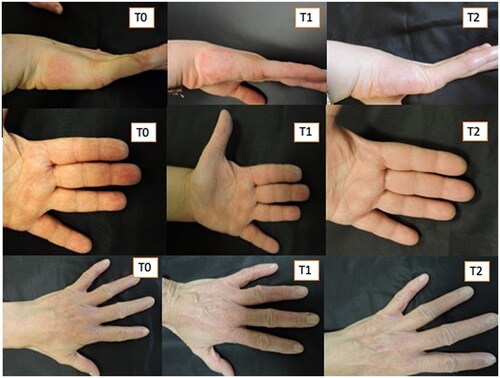
Figure 4. Three patients of control group. Worsening of HE during the two months of treatment.
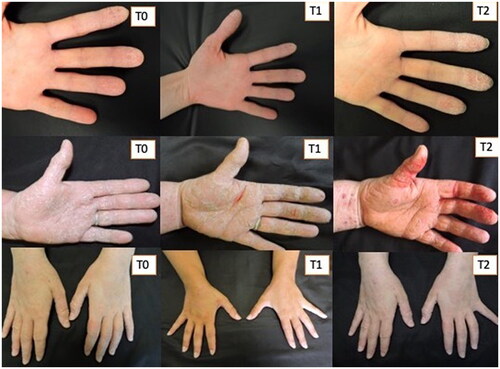
Table 4. Subjects who had an improvement: they moved from a worst to higher score categories.
Table 5. Repeated measures models considering as outcome the dermatological scores (HECSI, DLQI, QOLHEC) and as covariate the time and the treatment.
Figure 5. Graphical representation of CPDI, OCI, and SCL-9 0 measures for non-treated and treated subjects in the two Temporal times (T0, T2). for SCL-90, to better visualize the data we did not show one datum for the non-treatment group that was higher than 200 (outlier values).
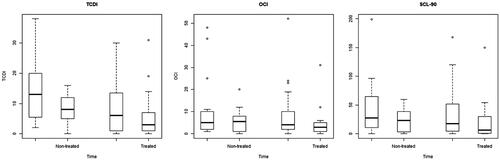
Table 6. Difference of median [IQR] values of psychological indicators separated for non-treated and treated patients.
Table 7. Association among psychometric and dermatological questionnaires: dermatological score was considered in dichotomous way (improved vs non-improved) while psychometric one in numerical way.
Supplemental Material
Download PDF (21.7 KB)Data availability statement
The data will be available from the authors upon request.