
Figures & data
Table 1. Patient demographics, lifestyle, and disease characteristics at enrollment, stratified by BSA.
Figure 1. Treatment characteristics at enrollment, stratified by BSA: (a) current therapiesa; (b) prior therapiesa. aNot mutually exclusive. Pairwise ES for between-group differences were calculated using Cohen’s w using thresholds of 0.1, 0.3, and 0.5, for small, medium, and large differences, respectively. AD: atopic dermatitis; BSA: body surface area; ES: effect size; TCI: topical calcineurin inhibitors.
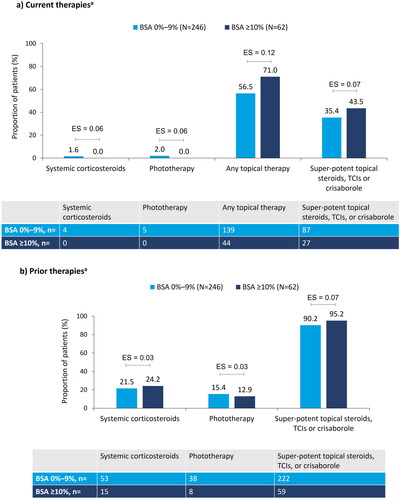
Figure 2. Clinical characteristics of AD at enrollment, stratified by BSA: (a) sites of involvement; (b) difficult locations of involvement. Pairwise effect sizes for between-group differences were calculated using Cohen’s w using thresholds of 0.1, 0.3, and 0.5 for small, medium, and large differences, respectively. AD: atopic dermatitis; BSA: body surface area.
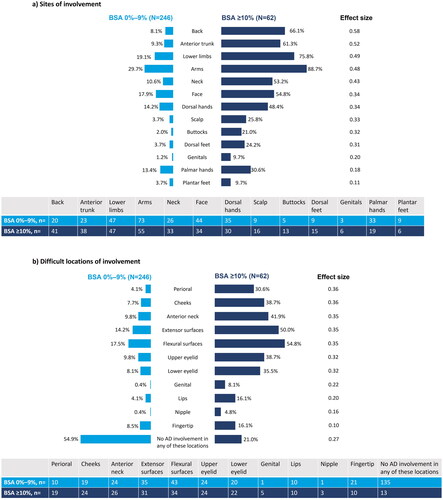
Figure 3. AD disease severity at enrollment, stratified by BSA: (a) vIGA-AD; (b) Total BSA, EASI, SCORAD, and overall severity of nail changes. aBSA 0%–9%: N = 245; bBSA 0%–9%: N = 243, BSA ≥10%: N = 61. Pairwise ES for between-group differences were calculated using Cohen’s w for vIGA-AD and Cohen’s d for total BSA (% involvement), EASI, SCORAD, and overall severity of nail changes. The thresholds for small, medium, and large differences were 0.1, 0.3, and 0.5, respectively, for Cohen’s w and 0.2, 0.5, and 0.8, respectively, for Cohen’s d. AD: atopic dermatitis; BSA: body surface area; EASI: Eczema Area Severity Index; ES: effect size; SCORAD: SCORing AD; SD: standard deviation; VAS: visual analog scale; vIGA-AD: validated Investigator Global Assessment for AD.
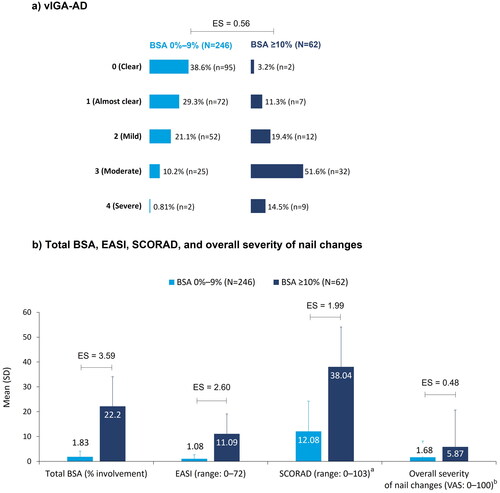
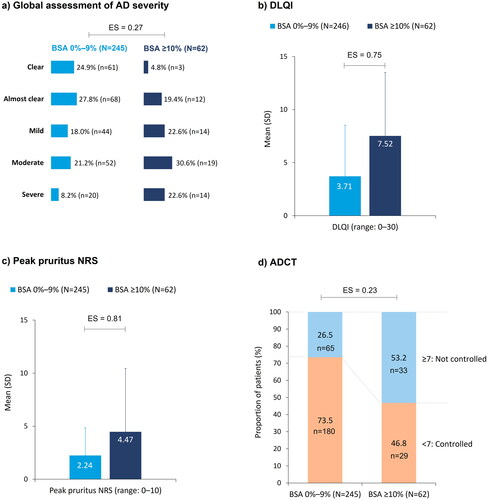
Figure 4. Patient-reported outcomes at enrollment, stratified by BSA: (a) global assessment of AD severity; (b) DLQI; (c) peak pruritus NRS; (d) ADCT. Pairwise ES for between-group differences were calculated using Cohen’s w for global assessment of AD severity and ADCT, and Cohen’s d for DLQI and peak pruritus. The thresholds for small, medium, and large differences were 0.1, 0.3, and 0.5, respectively, for Cohen’s w and 0.2, 0.5, and 0.8, respectively, for Cohen’s d. AD: atopic dermatitis; ADCT: Atopic Dermatitis Control Tool; BSA: body surface area; DLQI: Dermatology Life Quality Index; ES: effect size; NRS: numeric rating scale; SD: standard deviation.
Supplemental Material
Download PDF (179.3 KB)Data availability statement
Data are available from CorEvitas, LLC through a commercial subscription agreement and are not publicly available. No additional data are available from the authors.