Figures & data
Figure 1. Example of a discrete-choice experiment question. Respondents were asked which of three options they would choose if these were the only options available.
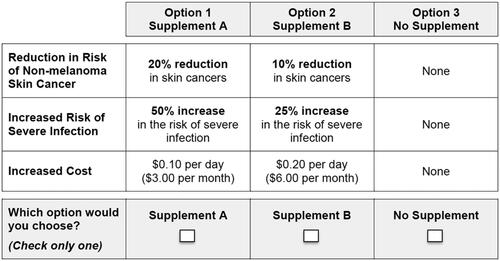
Table 1. Descriptive statistics (N = 203).
Figure 2. Preference weights, random-parameters logit model estimates, final model specification (N = 203). Attributes are presented in the order in which they appeared in the DCE questions. The vertical bars around each mean preference weight represent the 95% CI around the point estimate. The levels for the reduction in risk of non-melanoma skin cancer are effects-coded, so the sum of preference weights across levels of an attribute equals zero; 50% reduction in skin cancers was omitted in model estimation and retrieved for the plot. Within each attribute, a higher preference weight indicates that a level is more preferred. The change in utility associated with a change in the levels of each attribute is represented by the vertical distance between the preference weights for any two levels of that attribute. Larger differences between preference weights indicate that respondents viewed the change as having a relatively greater effect on overall utility.
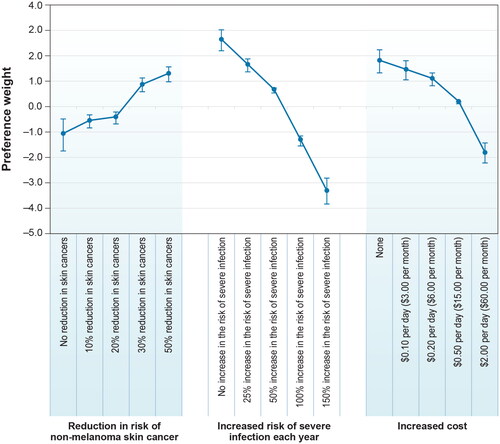
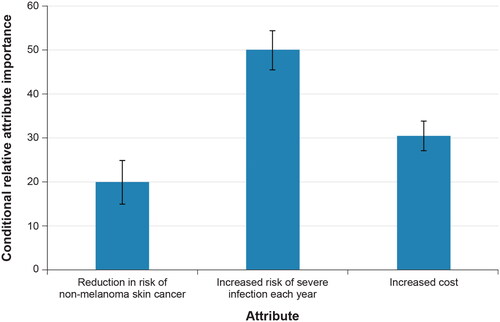
Figure 3. Scaled conditional relative importance of attributes, random-parameters logit model estimates, final model specification (N = 203). Attributes are presented in the order in which they appeared in the DCE questions. The conditional relative importance is the difference between the coefficient on the most- and least-preferred attribute level. These differences are summed across attributes and the sum is scaled to 100. The standard errors and the 95% CI for these differences were calculated using the delta method. The 95% CI around the point estimate is represented by the black vertical bars on top of the blue bars.