
Figures & data
Figure 1. Schematic overview of the whole study. (A) A framework for biomarker discovery in psoriasis treatment. (B) The study cohort included 65 psoriasis patients. Clinical parameters are indicated in the heatmap. (C) The skin photos of the responders and non-responders. PB means before treatment and PA means after treatment.
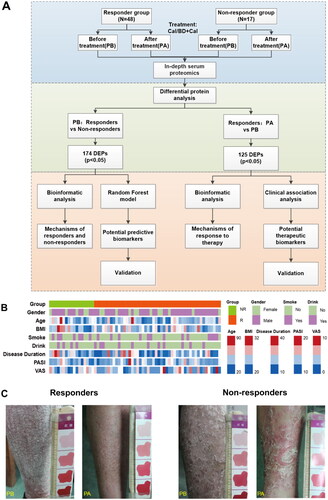
Figure 2. Profiling of serum proteome in responder and non-responder psoriasis patients using in-depth proteomics. (A) Distribution of serum proteins detected by in-depth proteomics according to the reference concentrations in the human plasma proteome database (http://www.plasmaproteomedatabase.org/). (B) and (C) Enrichment of protein classes for psoriasis-associated proteins identified by antibody arrays and DIA-MS, respectively. (D) Detected therapeutic target proteins, which were identified using a therapeutic target database (TTD) (http://db.idrblab.net/ttd/). (E) Diseases associated with the detected therapeutic target proteins. Circle sizes correspond to the number of proteins enriched in each disease.
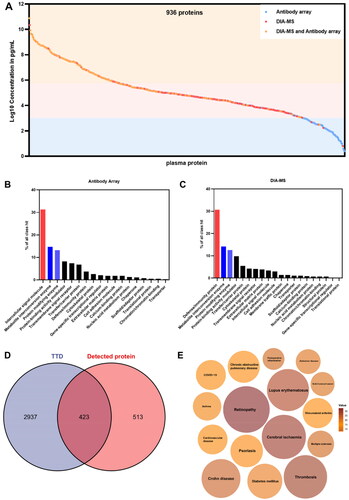
Table 1. baseline characteristics of study participants treated with topical sequential therapy.
Figure 3. Proteomic analysis predicts differential response to topical sequential therapy. (A) Identification of DEPs between responder and non-responder group at baseline using volcano plot analysis. The p-value indicated on the graph is 0.05. Upregulated and downregulated proteins are indicated in red and blue dots. (B) Classification of responder and non-responder groups based on differentially expressed proteins (DEPs) and unbiased clustering analysis. (C) and (D) are functional analysis of upregulated and downregulated DEPs identified by text mining using Cytoscape and ClueGO, respectively. A p-value < 0.05 was used for biological process selection. (E) Functional categories higher in responders (left) and non-responders (right), as illustrated by using Proteomaps. Each polygon corresponds to a single KEGG pathway, and the size correlates with the ratio between the groups.
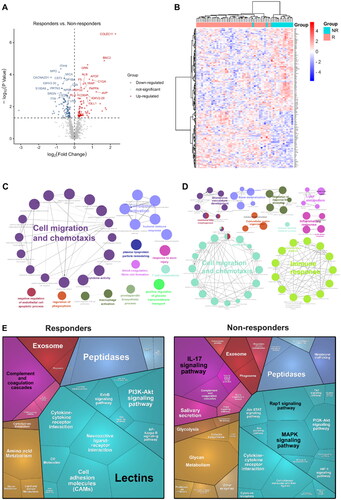
Figure 4. Proteomic analysis predicts differential response to topical sequential therapy. (A) Classification of responder and non-responder group based on 30 DEPs (p.adjust < 0.05) and unbiased clustering analysis. (B) Principal component analysis plot shows unsupervised clustering among the 65 samples, demonstrating a distinction between responder and non-responder groups to topical sequential therapy. (C) Discrimination of psoriasis patients’ response to treatment by the DEPs using ROC curve analysis. (D) Ranking of the 30 proteins’ importance. (E) The AUC curves of the top 4 proteins (COLEC11, BNC2, ITIH4, C1QA) were 0.9354, 0.8694, 0.8472, and 0.8139, respectively. (F) Box plot analysis of COLEC11, BNC2, ITIH4 and C1QA in responder and non-responder group at baseline. The statistical analysis was performed using a Mann-Whitney U test with a p-value ≤ 0.05. *, ** and *** represent the p-value less than 0.05, 0.005 and 0.0005, respectively.
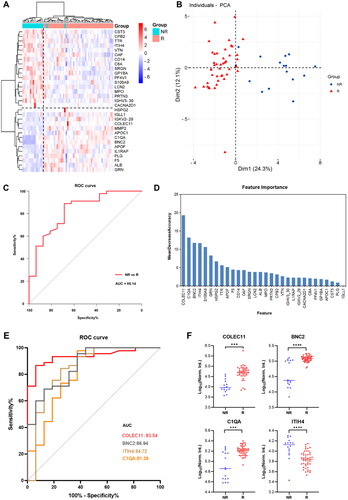
Figure 5. Proteomic analysis on the mechanisms of response to topical sequential therapy. (A) Identification of DEPs between PA and PB in responder group using volcano plot analysis. The p-value indicated on the graph is 0.05. (B) Classification of PA and PB in responder group based on DEPs and partial least squares discriminant analysis. (C) Pathway enrichment analysis of DEPs using the KEGG database. (D) Is functional analysis of downregulated DEPs identified by text mining using Cytoscape and ClueGO. A p-value < 0.05 was used for biological process selection.
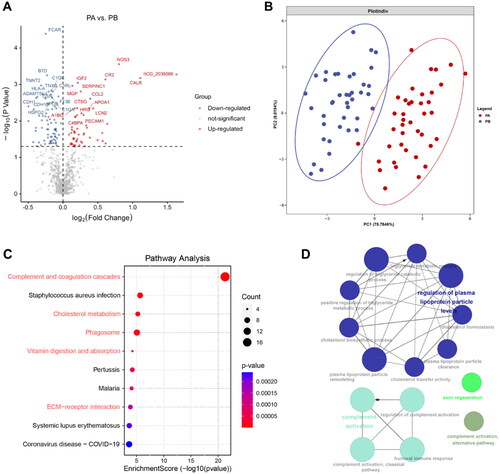
Figure 6. Identification of serum proteins related to psoriasis severity. (A) KEGG enrichment analyses were carried out for the 42 core proteins, with p and q < 0.05. (B) The scatter plots show the correlations between BTD, TNC, CD14, CFH expression levels and PASI score (p < 0.05). Significance was tested using the pearson or spearman correlation coefficient. (C) Box plot analysis of BTD, TNC, CD14 and CFH downregulated in responder group after treatment. The statistical analysis was performed using a Mann-Whitney U test with a p-value ≤ 0.05. *, ** and *** represent the p-value less than 0.05, 0.005 and 0.0005, respectively. (D) The scatter plots show the correlations between FCAR, BTD, F13B, COMP expression levels and VAS score (p < 0.05). Significance was tested using the pearson or spearman correlation coefficient. (E) Box plot analysis of CD14 in responder group after treatment. (F) The scatter plots show the correlations between CD14 expression levels and PASI score (p < 0.05).
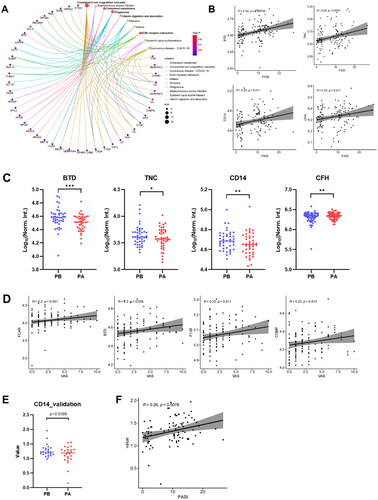
Table 2. clinical data of responder and non-responder at 0 week and 12 weeks.
Supplemental Material
Download PDF (592 KB)Data availability statement
The data that supporting the findings of this study are available on request from the corresponding author. The data are not publicly available due to privacy or ethical restrictions.