
Figures & data
Table 1. Demographics and baseline characteristics of patients with atopic dermatitis (n = 20).
Figure 1. The improvement of total EASI (a) and PP-NRS (b) after switching from baricitinib 4 mg to upadacitinib 30 mg in patients with atopic dermatitis (n = 20). (c) percent reductions of total EASI and PP-NRS from baseline. The data are shown as median [interquartile]. **p < 0.01 versus values at baseline; †p < 0.05, ††p < 0.01 versus values at week 0, by friedman’s test with Bonferroni post-hoc test.
![Figure 1. The improvement of total EASI (a) and PP-NRS (b) after switching from baricitinib 4 mg to upadacitinib 30 mg in patients with atopic dermatitis (n = 20). (c) percent reductions of total EASI and PP-NRS from baseline. The data are shown as median [interquartile]. **p < 0.01 versus values at baseline; †p < 0.05, ††p < 0.01 versus values at week 0, by friedman’s test with Bonferroni post-hoc test.](/cms/asset/11300065-b125-418b-8e4b-ad246b0c4cc1/ijdt_a_2276043_f0001_c.jpg)
Figure 2. The achievement rates of EASI 75, EASI 90, and PP-NRS 4 at week 0, 4 and 12 after switching from baricitinib 4 mg to upadacitinib 30 mg in patients with atopic dermatitis (n = 20). †p < 0.05, ††p < 0.01 versus values at week 0, by Fisher’s exact test.
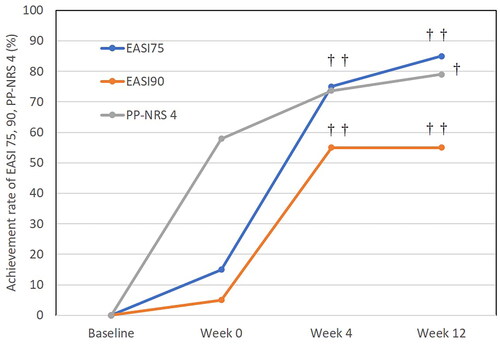
Figure 3. The improvement of EASI scores at head and neck (a), upper limbs (b), lower limbs (c), and trunk (d) after switching from baricitinib 4 mg to upadacitinib 30 mg in patients with atopic dermatitis (n = 20). the data are shown as median [interquartile range]. *p < 0.05, **p < 0.01 versus values at baseline; †p < 0.05, ††p < 0.01 versus values at week 0, by friedman’s test with Bonferroni post-hoc test.
![Figure 3. The improvement of EASI scores at head and neck (a), upper limbs (b), lower limbs (c), and trunk (d) after switching from baricitinib 4 mg to upadacitinib 30 mg in patients with atopic dermatitis (n = 20). the data are shown as median [interquartile range]. *p < 0.05, **p < 0.01 versus values at baseline; †p < 0.05, ††p < 0.01 versus values at week 0, by friedman’s test with Bonferroni post-hoc test.](/cms/asset/ab9441b9-9eea-4f03-8cc2-57cff81f48bd/ijdt_a_2276043_f0003_c.jpg)
Figure 4. Percent reductions from baseline in EASI scores on head and neck, upper limbs, lower limbs, and trunk at week 0, 4 and 12 after switching from baricitinib 4 mg to upadacitinib 30 mg in patients with atopic dermatitis (n = 20). data are presented as median [interquartile range]. †p < 0.05, ††p < 0.01 versus values at week 0, by friedman’s test with Bonferroni post-hoc test.
![Figure 4. Percent reductions from baseline in EASI scores on head and neck, upper limbs, lower limbs, and trunk at week 0, 4 and 12 after switching from baricitinib 4 mg to upadacitinib 30 mg in patients with atopic dermatitis (n = 20). data are presented as median [interquartile range]. †p < 0.05, ††p < 0.01 versus values at week 0, by friedman’s test with Bonferroni post-hoc test.](/cms/asset/ad203c87-23a1-4c27-8abf-38561d6a770e/ijdt_a_2276043_f0004_c.jpg)
Figure 5. The improvement of EASI scores of erythema (a), edema/papulation (b), excoriation (c), or lichenification (d) after switching from baricitinib 4 mg to upadacitinib 30 mg in patients with atopic dermatitis (n = 20). the data are shown as median [interquartile range]. *, p < 0.05, **p < 0.01 versus values at baseline; †p < 0.05, ††p < 0.01 versus values at week 0, by friedman’s test with Bonferroni post-hoc test.
![Figure 5. The improvement of EASI scores of erythema (a), edema/papulation (b), excoriation (c), or lichenification (d) after switching from baricitinib 4 mg to upadacitinib 30 mg in patients with atopic dermatitis (n = 20). the data are shown as median [interquartile range]. *, p < 0.05, **p < 0.01 versus values at baseline; †p < 0.05, ††p < 0.01 versus values at week 0, by friedman’s test with Bonferroni post-hoc test.](/cms/asset/049544d1-35f6-48fe-8c69-a2908069565c/ijdt_a_2276043_f0005_c.jpg)
Figure 6. Percent reductions from baseline in EASI scores of erythema, edema/papulation, excoriation, and lichenification at week 0, 4 and 12 after switching from baricitinib 4 mg to upadacitinib 30 mg in patients with atopic dermatitis (n = 20). data are presented as median [interquartile range]. †p < 0.05, ††p < 0.01 versus values at week 0; §p < 0.05, versus values at week 4, by friedman’s test with Bonferroni post-hoc test.
![Figure 6. Percent reductions from baseline in EASI scores of erythema, edema/papulation, excoriation, and lichenification at week 0, 4 and 12 after switching from baricitinib 4 mg to upadacitinib 30 mg in patients with atopic dermatitis (n = 20). data are presented as median [interquartile range]. †p < 0.05, ††p < 0.01 versus values at week 0; §p < 0.05, versus values at week 4, by friedman’s test with Bonferroni post-hoc test.](/cms/asset/ed943014-656a-43f5-a3ca-b835342d12da/ijdt_a_2276043_f0006_c.jpg)
Figure 7. The transition of total eosinophil count (TEC) (a), LDH (b), TARC (c) and IgE (d) after switching from baricitinib 4 mg to upadacitinib 30 mg in patients with atopic dermatitis (n = 20). the data are shown as median [interquartile range]. *p < 0.05 versus values at baseline; †p < 0.05, ††p < 0.01 versus values at week 0; §p < 0.05, versus values at week 4, by Friedman’s test with Bonferroni post-hoc test.
![Figure 7. The transition of total eosinophil count (TEC) (a), LDH (b), TARC (c) and IgE (d) after switching from baricitinib 4 mg to upadacitinib 30 mg in patients with atopic dermatitis (n = 20). the data are shown as median [interquartile range]. *p < 0.05 versus values at baseline; †p < 0.05, ††p < 0.01 versus values at week 0; §p < 0.05, versus values at week 4, by Friedman’s test with Bonferroni post-hoc test.](/cms/asset/acd48284-1c67-42d6-ab2d-1e42bb9280a4/ijdt_a_2276043_f0007_c.jpg)
Table 2. Treatment-emergent adverse events (TEAEs) during treatment with baricitinib 4 mg or after switching to upadacitinib 30 mg in patients with atopic dermatitis (n = 20).
Supplemental Material
Download PDF (229.9 KB)Data availability statement
The datasets used and/or analyzed during the current study are available from the corresponding author upon reasonable request.