
Figures & data
Table 1. Clinical and laboratory findings of moderate to severe acne patients and healthy controls.
Figure 1. Comparisons of alpha and beta diversity indices of gut microbiota among the samples. (A,B) Comparison of Shannon and Simpson indexes among the baseline HC group, the AVP and AVW group before and after treatment. (C) Differences among the HC group and the AVP group before and after treatment were assessed by PCoA (R2 = 0.06, p = .03). (D) Differences among the HC group and the AVW group before and after treatment were assessed by PCoA (R2 = 0.05, p = .18). 0, the group before treatment; 1, the group after treatment; * (AVP0 vs.), *p < .05, **p < .01, ***p < .001; # (AVW0 vs.), #p < .05, ##p < .01, ###p < .001; ▲ (AVP1 vs AVW1), ▲p < .05, ▲▲p < .01, ▲▲▲p < .001; AVP: the AV patients with treatment of isotretinoin; AVW: the AV patients with treatment of ω-3 fatty acids; HC: healthy control group.
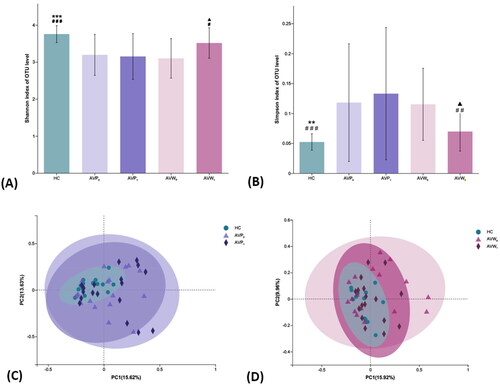
Figure 2. Comparisons of gut differential bacteria in genus level among the samples before and after different intervention, and distribution of KEGG functional categories on intestinal microbiota in the ω-3 fatty acids intervention group. (A–E) Comparison of the relative contents of Coprococcus, Lactococcus, Eubacterium, Intestinibacter and Holdemania before and after the intervention in each group. (F) Comparison of KEGG functional enrichment pathways on intestinal microbiota on level 3 between acne patients before and after ω-3 fatty acids treatment. The abscissa is the enrichment significance -log10 (p-value), and only the pathways with p < .05 which is considered statistically significant are listed in the figure; the ordinate is the name of KEGG pathway. The size of bubble in the figure represents the amount of metabolites enriched in the metabolic concentration in this pathway; 0, the group before treatment; 1, the group after treatment; * (AVP0 vs.), *p < .05, **p < .01, ***p < .001; # (AVW0 vs.), #p < .05, ##p < .01, ###p < .001; AVP, the AV patients with treatment of isotretinoin; AVW, the AV patients with treatment with ω-3 fatty acids; HC, healthy control group.
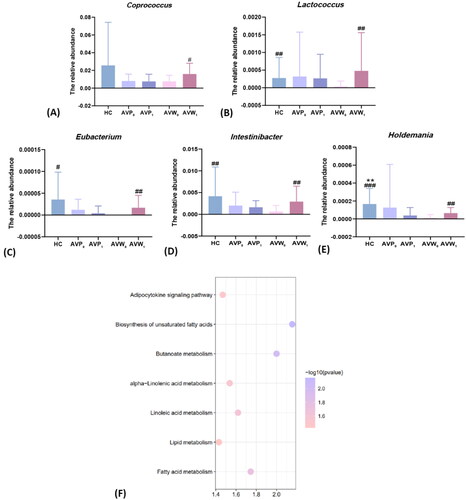
Figure 3. Effects of different intervention methods on the severity and histopathology of auricle lesions in SD rats of stage one. (A) The changes of auricle lesions of SD rats in each group after acne modeled. (B) The comparison of auricle swelling rate of SD rats in each group after acne modeled (n = 9). (C) The pathological changes of auricle tissue of SD rats in each group after acne modeled (40×, 400×). (D) The comparison of the number of Comedo in the rats' auricle pathological tissue in each group after modeled (n = 9) (HE staining, 40×). (E) The comparison of the number of inflammatory cells in the rats' auricle pathological tissue in each group after modeled (n = 9) (HE staining, 400×). * (acne vs.), *p < .05, **p < .01, ***p < .001; ▲ (Iso vs.), ▲p < .05, ▲▲p < .01, ▲▲▲p < .001; ♦ (ω-3 vs ω-3 + Iso), ♦p < .05, ♦♦p < .01, ♦♦♦p < .001; acne, the pure model group; Con, the blank control group; Iso, acne model combined with the isotretinoin treatment group; ω-3, acne model combined with the ω-3 fatty acids treatment group; ω-3 + Iso, acne model combined with the ω-3 fatty acids plus isotretinoin treatment group.
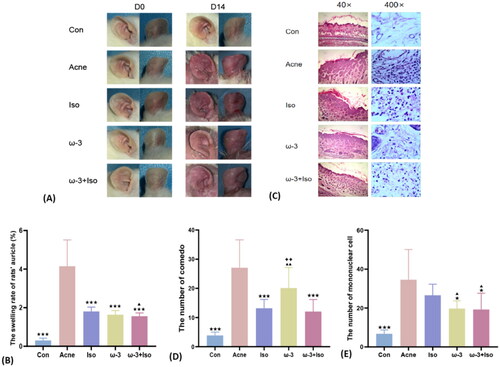
Figure 4. Comparisons of alpha diversity index and PCoA in each SD rat treatment group (n = 6) of stage one. (A,B) Comparison of Shannon and Simpson indies among each group before and after acne modeled. (C–E) Differences of gut microbiota structure between the Iso group (R = 0.04, p = .33), ω-3 group (R = 0.44, p = .003) and the ω-3 + Iso group (R = 0.68, p = 0.004) before and after acne modeled were assessed by PCoA. 1, before acne modeled; 2, after acne modeled; * (Acne2 vs.), *p < .05, **p < .01, ***p < .001; ▲ (Iso2 vs.), ▲p < .05, ▲▲p < .01, ▲▲▲p < .001; ● (ω-32 vs ω-31), *p < .05, **p < .01, ***p < .001; # [(ω-3 + Iso)2 vs (ω-3 + Iso)1], #p < .05, ##p < .01, ###p < .001; acne, the pure model group; Con, the blank control group; Iso, acne model combined with the isotretinoin treatment group; ω-3, acne model combined with the ω-3 fatty acids treatment group; ω-3 + Iso, acne model combined with the ω-3 fatty acids plus isotretinoin treatment group.
![Figure 4. Comparisons of alpha diversity index and PCoA in each SD rat treatment group (n = 6) of stage one. (A,B) Comparison of Shannon and Simpson indies among each group before and after acne modeled. (C–E) Differences of gut microbiota structure between the Iso group (R = 0.04, p = .33), ω-3 group (R = 0.44, p = .003) and the ω-3 + Iso group (R = 0.68, p = 0.004) before and after acne modeled were assessed by PCoA. 1, before acne modeled; 2, after acne modeled; * (Acne2 vs.), *p < .05, **p < .01, ***p < .001; ▲ (Iso2 vs.), ▲p < .05, ▲▲p < .01, ▲▲▲p < .001; ● (ω-32 vs ω-31), *p < .05, **p < .01, ***p < .001; # [(ω-3 + Iso)2 vs (ω-3 + Iso)1], #p < .05, ##p < .01, ###p < .001; acne, the pure model group; Con, the blank control group; Iso, acne model combined with the isotretinoin treatment group; ω-3, acne model combined with the ω-3 fatty acids treatment group; ω-3 + Iso, acne model combined with the ω-3 fatty acids plus isotretinoin treatment group.](/cms/asset/9e50caf9-ee88-47b5-81de-eef0784f3c9f/ijdt_a_2299107_f0004_c.jpg)
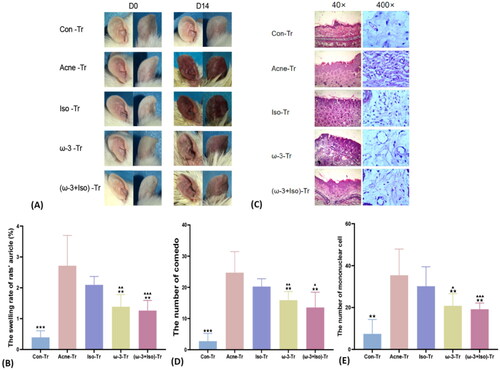
Figure 5. The severity and histopathology of auricle lesions in SD rats after FMT of stage two. (A) The changes of auricle lesions of SD rats in each group after acne modeled combined with FMT. (B) The comparison of auricle swelling rate of SD rats in each group after acne modeled combined with FMT (n = 9). (C) The pathological changes of auricle tissue of SD rats in each group after acne modeled combined with FMT (40×, 400×). (D) The comparison of the number of comedo in the rats' auricle pathological tissue in each group after modeled combined with FMT (n = 9) (HE staining, 40×). (E) The comparison of the number of inflammatory cells in the rats' auricle pathological tissue in each group after modeled combined with FMT (n = 9) (HE staining, 400×). * (acne-Tr vs.), *p < .05, **p < .01, ***p < .001; ▲ (Iso-Tr vs.), ▲p < .05, ▲▲p < .01, ▲▲▲p < .001; acne-Tr, FMT of the acne group combined with acne model; Con-Tr, FMT of the Con group; Iso-Tr, FMT of the Iso group combined with acne model; ω-3-Tr, FMT of the ω-3 group combined with acne model; (ω-3 + Iso)-Tr, FMT of the ω-3 + Iso group combined acne with model.
Supplemental Material
Download PDF (587.1 KB)Data availability statement
Data described in the manuscript will be made available upon request.