Figures & data
Figure 1. Flow chart of trial identification and selection.
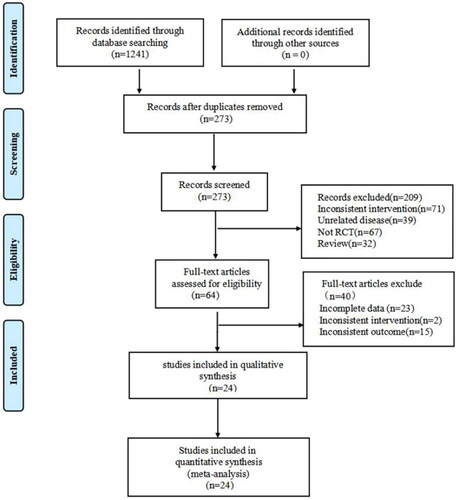
Table 1. Studies included.
Figure 2. Risk assessment chart.
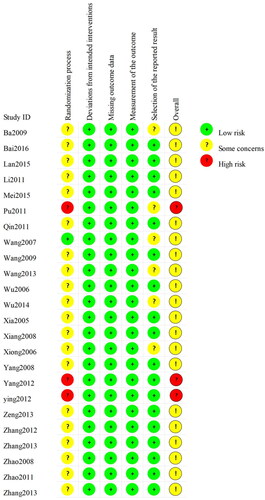
Figure 3. Total efficiency rate.
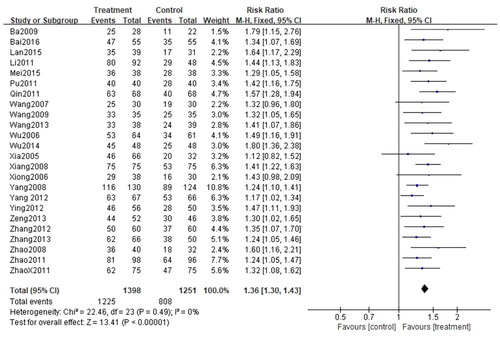
Figure 4. Cure rate.
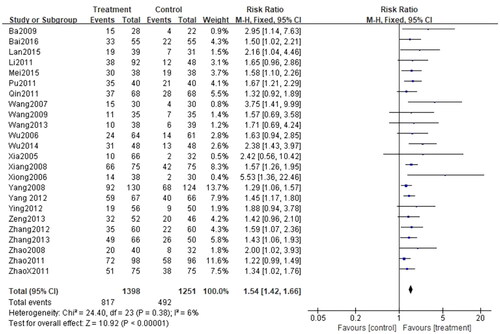
Figure 5. Recurrence rate.
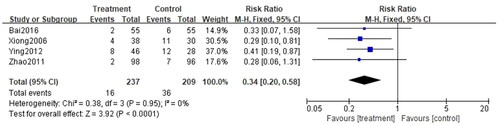
Figure 6. Rates of adverse events.
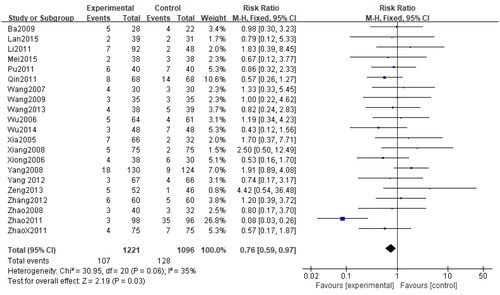
Figure 7. Total efficiency rates using different CG formulations.
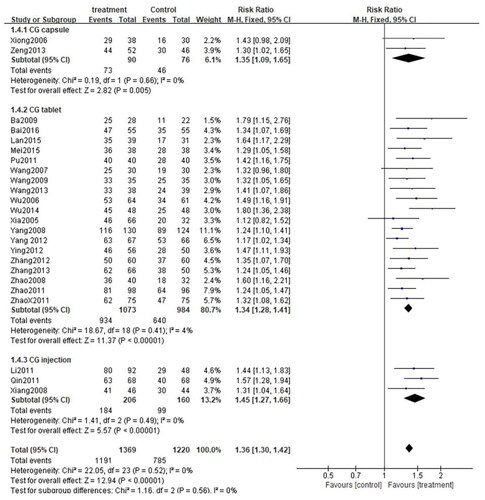
Figure 8. Rate of adverse events using different CG formulations.
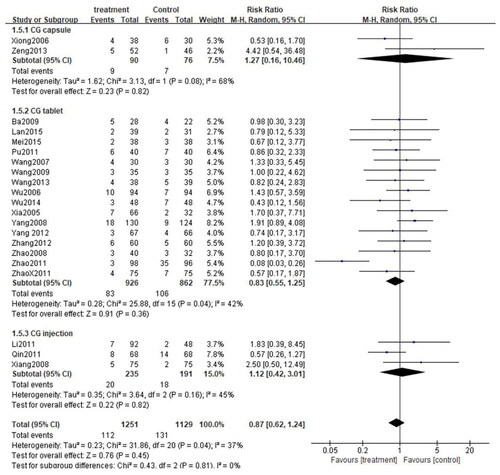
Figure 9. Cure rate using different formulations of CG.
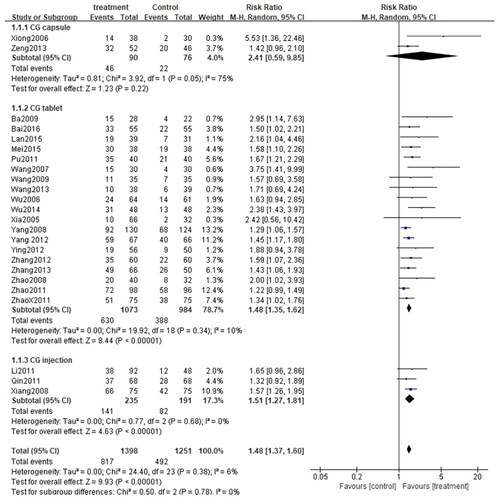
Figure 10. Total efficiency rate stratified by treatment duration.
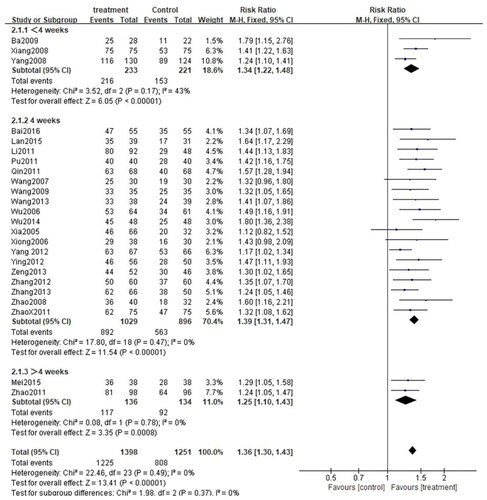
Figure 11. Rate of adverse events stratified by treatment duration.
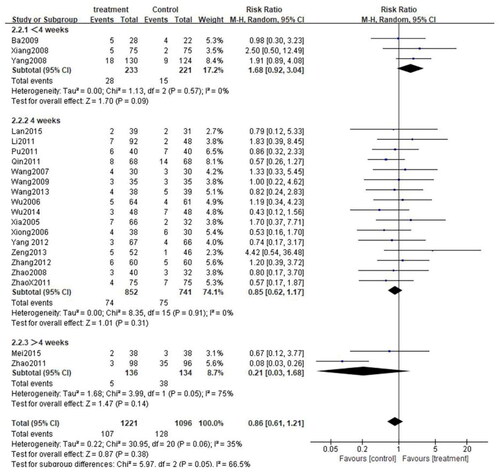
Figure 12. Cure rate stratified by treatment duration.
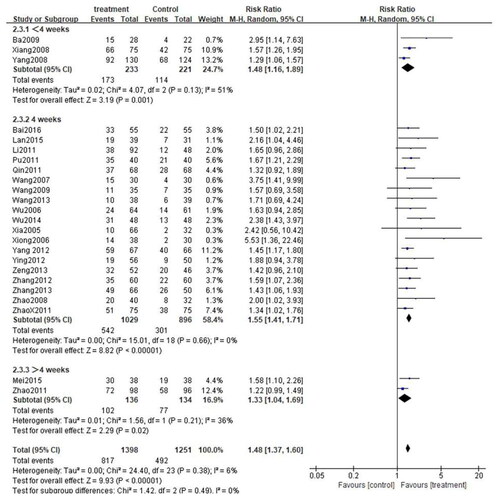
Figure 13. Sensitivity analysis of the total efficiency rate.
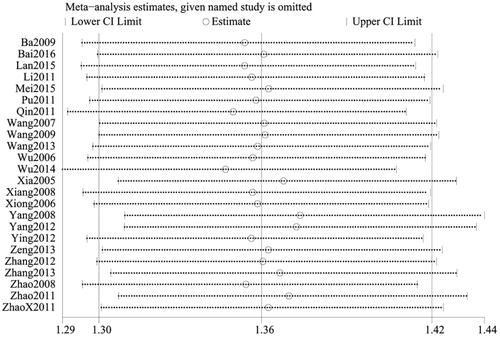
Figure 14. Sensitivity analysis of cure rate.
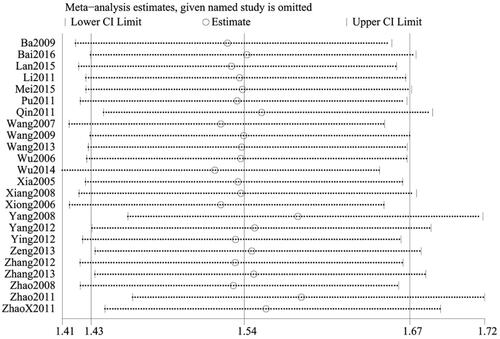
Figure 15. Sensitivity analysis of recurrence rate.
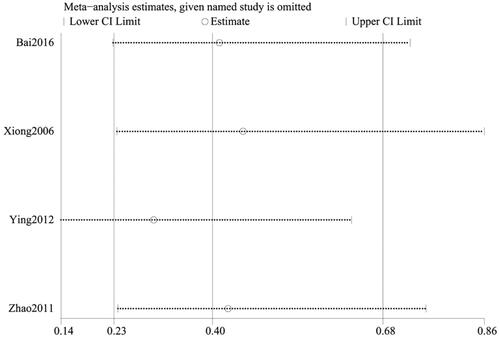
Figure 16. Sensitivity analysis of rate of adverse events.
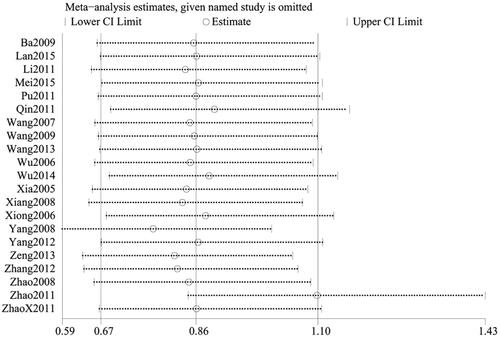
Figure 17. A funnel plot was generated to assess publication bias.
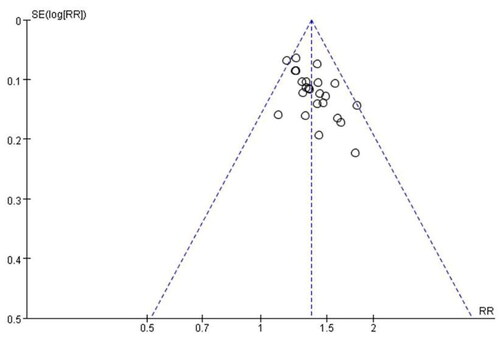
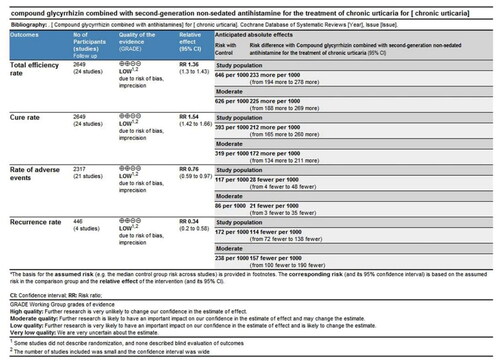
Figure 18. Evidence quality evaluation results.