
Figures & data
Table 1. Baseline characteristics of patients with psoriasis treated with deucravacitinib (n = 33).
Figure 1. The transition of total psoriasis area and severity index (PASI) scores (a), PASI scores on head and neck (b), trunk (c), upper limbs (d), and lower limbs (e) during deucravacitinib treatment in patients with psoriasis (n = 33). Data are provided as the median [interquartile range]. *p < .05, **p < .01 versus values of week 0; †p < .05, ††p < .01 versus values of week 2; §p < .05 versus values of week 4; #p < .05 versus values of week 6, assessed by Friedman’s test with Bonferroni’s post hoc test.
![Figure 1. The transition of total psoriasis area and severity index (PASI) scores (a), PASI scores on head and neck (b), trunk (c), upper limbs (d), and lower limbs (e) during deucravacitinib treatment in patients with psoriasis (n = 33). Data are provided as the median [interquartile range]. *p < .05, **p < .01 versus values of week 0; †p < .05, ††p < .01 versus values of week 2; §p < .05 versus values of week 4; #p < .05 versus values of week 6, assessed by Friedman’s test with Bonferroni’s post hoc test.](/cms/asset/9b14877d-b888-4c3e-875c-1edd00780487/ijdt_a_2307489_f0001_c.jpg)
Table 2. The laboratory parameters at weeks 0, 4, and 16 of deucravacitinib treatment, and the comparisons between the stages (n = 33).
Table 3. Correlations between percent reduction of total PASI versus those of laboratory parameters at weeks 4 or 16 of deucravacitinib treatment in patients with psoriasis (n = 33).
Figure 2. Achievement rates of total psoriasis area and severity index (PASI) 75, PASI 90, PASI 100, absolute PASI ≤2, absolute PASI ≤1 during deucravacitinib treatment in patients with psoriasis (n = 33).
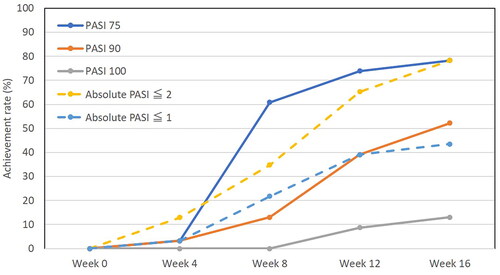
Figure 3. The transition of peak pruritus-numerical rating scale (PP-NRS) (a), and achievement rate of PP-NRS4 (b) during deucravacitinib treatment in psoriasis patients with baseline pruritus (n = 14). Data are provided as the median [interquartile range]. *p < .05 versus values of week 0, assessed by Friedman’s test with Bonferroni’s post hoc test.
![Figure 3. The transition of peak pruritus-numerical rating scale (PP-NRS) (a), and achievement rate of PP-NRS4 (b) during deucravacitinib treatment in psoriasis patients with baseline pruritus (n = 14). Data are provided as the median [interquartile range]. *p < .05 versus values of week 0, assessed by Friedman’s test with Bonferroni’s post hoc test.](/cms/asset/643b57a4-fec7-4dbd-aa01-df8ff044db53/ijdt_a_2307489_f0003_c.jpg)
Table 4. Correlations between percent reductions of PP-NRS versus those of clinical indexes at weeks 4, 8, 12, or 16 of deucravacitinib treatment in psoriasis patients with baseline pruritus (n = 14).
Table 5. Treatment-emergent adverse events (TEAEs) until week 16 of deucravacitinib treatment in patients with psoriasis (n = 33).
Data availability statement
The datasets used and/or analyzed during the current study are available from the corresponding author upon reasonable request.