
Figures & data
Table 1. Reported foci yields ± Poisson standard errors (SE) obtained by the laboratories using manual and automated scoring. Also shown are the constant (C) and linear calibration coefficients (α) and associated standard errors used to convert foci counts into dose estimates.
Figure 1. Average gamma-H2AX-based dose estimates versus the true doses for blood and lymphocyte ex vivo incubated samples; excluding 24-h blood samples. Error bars show the standard deviation between 5 and 7 (blood) and 11–14 (lymphocyte) measurements for each sample taken from . The line is not a fit but indicates the ideal 1:1 relationship.
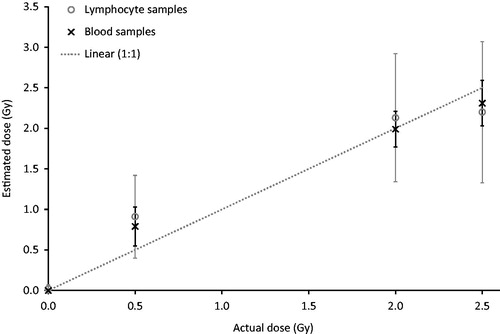
Table 2. Reported foci-based dose estimates ± standard error obtained by the laboratories for the coded blood and lymphocyte samples shipped from lab1 to the participants following 60Co gamma irradiation and 4-/24-h ex vivo incubation at 37 °C. Triage categories of <1 Gy, 1–2 Gy and >2 Gy are highlighted in the table in white, light grey and dark grey, respectively.