
Figures & data
Table 1. Demographical and clinical characteristics of the patients that were interviewed.
Table 2. Preliminary version used in the quantitative study: overview of the items for each daily life activity across the cognitive (sub)domains.
Table 3. Demographic and clinical characteristics of the participants in the quantitative study.
Figure 1. Percentage of patients reporting complaints per daily life activity. A hierarchy was created among the complaints and differentiated between the level of restrictions, dependence, and incapability.
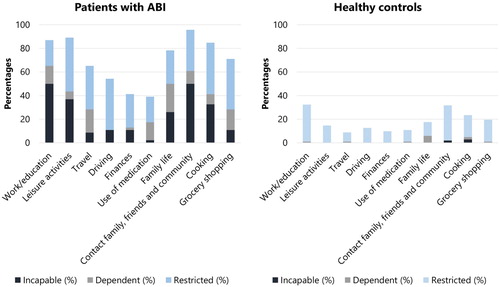
Table 4. Percentage of patients and healthy controls reporting complaints per daily life activity.
Table 5. Comparison of the level of fatigue (mean VAS scores) per daily life activity between patients and healthy controls.
Table 6. Percentage of patients and healthy controls reporting complaints per cognitive domain.
Figure 2. The distribution of complaints scores for patients with ABI and healthy controls. The converted complaints scores to a 0–100 scale are presented on the x-axis. Higher scores indicated a higher degree of reported complaints. The percentages of patients are presented on the y-axis.
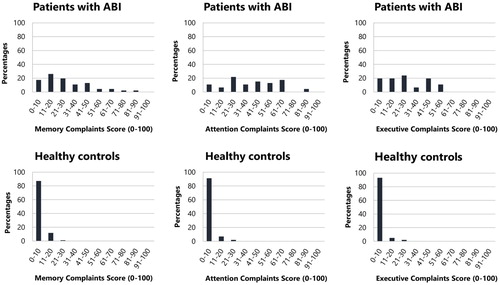
Table 7. Comparison of the complaints scores (higher scores indicate a higher level of complaints) between patients’ and relatives’ reports.
Table 8. Comparison of the level of fatigue (mean VAS score) as reported by patients and their relatives, split per daily life activity.
Supplemental material