Figures & data
Figure 1. Study design and protocol.
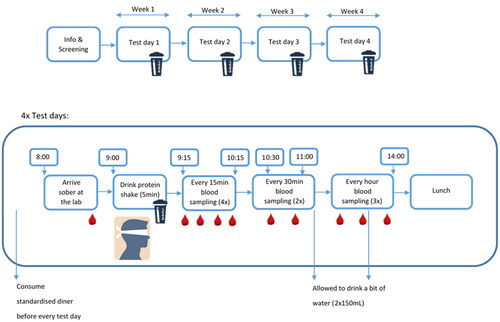
Table 1. Subject characteristics.
Table 2. Macronutrient composition protein drinks.
Figure 2. Plasma AA response for all four protein conditions; AA totals (TAA), essential AA (TEAA) and branched-chain AA (BCAA), respectively. Mean ± SD, for clarity only SD for milk protein (positive) and micellar casein (negative SD bar) are given.
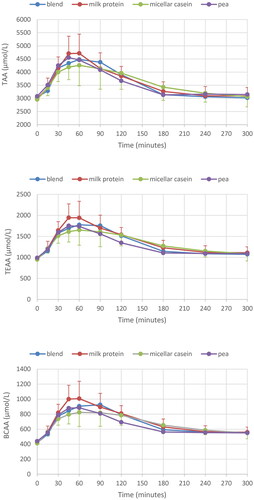
Figure 3. Plasma AA response for all four protein conditions; leucine, arginine, methionine and lysine, respectively. Mean ± SD, for clarity only SD for the highest curve (positive) and lowest curve (negative SD bar) are given.
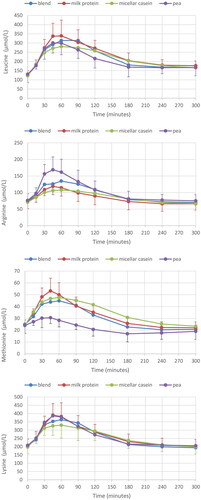
Figure 4. Plasma insulin response for all four protein conditions. Mean ± SD; for clarity only SD for pea (positive) and casein (negative SD bar) are given.
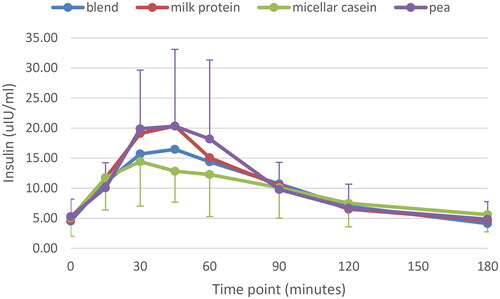
Figure 5. Fitted area under the curve (AUC, µM·min) and peak height (µmol/L), corrected for baseline, and time to max (Time2Max, min) values for each individual amino acid for all four protein conditions (average + CI). Asp, Cys, Glu and Gly were not considered due to too much missing values in curve fitting as blood levels were very low and/or showed no clear response; *significant different from pea (p < .05, with multiple-testing correction (Dunnett)).
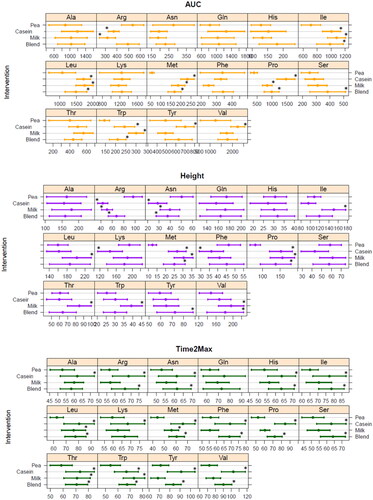
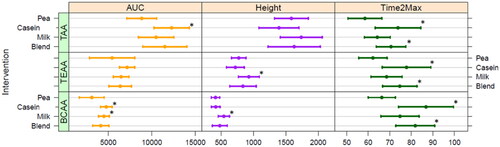
Figure 6. Fitted area under the curve (AUC, µM·min) and peak height (µmol/L), corrected for baseline, and time to max height (Time2Max, min) values for amino acid totals for all four protein conditions (average + CI). *Significant different from pea.