
Figures & data
Table 1. Description of the food groups in CIMI-algorithm.
Table 2. Socio-demographic characteristics of women who participated in Scale-N and Trans-SEC surveys.
Table 3. Comparison of means and medians of energy and nutrient intake calculated by CIMI and NutriSurvey in Chamwino and Kilosa district.
Figure 1. Scatter plots (upper row) and Bland-Altman plots (lower row) of energy (A,B), protein (C,D), iron (E,F) and zinc (G,H) intake calculated by CIMI and NutriSurvey (NS). Scatter plots include predictive equations, vertical lines in the Bland-Altman plots represent the recommended nutrient intake values (RNI).
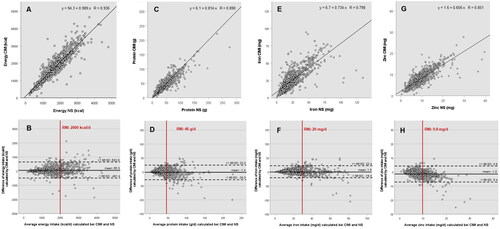
Table 4. Haemoglobin, iron status (iron stores, serum ferritin and soluble transferrin receptor) and serum retinol and zinc of the women who participated in the Scale-N survey.
Table 5. Prevalence of anaemia and vitamin A, iron and zinc micronutrient deficiencies in the Scale-N women depending on nutrient intake (vs. < and ≥ RNI) calculated by CIMI-algorithm and NutriSurvey.