
Figures & data
Figure 1. Flow chart and number of valid assessments at each time point. FU: follow-up; SRT: Steep Ramp Test. †Malperformance due to limited range of motion of one or both knees. ‡Another protocol than required for that participant, or using a manual instead of software-driven workload increment program.
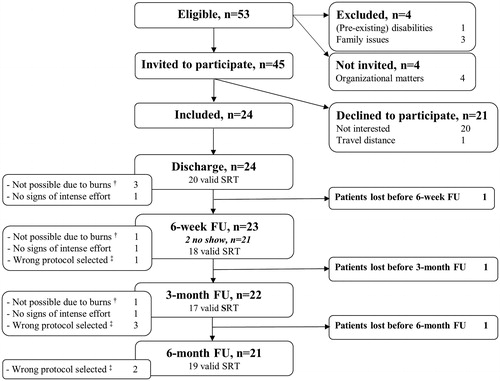
Table 1. Characteristics of participants and non-participants.
Figure 2. The course of exercise capacity in pediatric burn patients after discharge—output from multilevel regression modeling (n = 21). Group Z-scores represent the mean of individual Z-scores (each individual POpeak/kg score compared to an age- and sex-specific reference value). A Z-score of 0 (solid black line) indicates POpeak/kg equal to the mean score of age- and sex-matched healthy controls [Citation32]. A Z-score of −1 (dashed red line) represents POpeak/kg one standard deviation below the age- and sex-specific healthy reference value. POpeak/kg: peak power output (in W) attained during the Steep Ramp Test relative to body weight (in kg); *p < 0.05, **p < 0.01, ***p < 0.001.
![Figure 2. The course of exercise capacity in pediatric burn patients after discharge—output from multilevel regression modeling (n = 21). Group Z-scores represent the mean of individual Z-scores (each individual POpeak/kg score compared to an age- and sex-specific reference value). A Z-score of 0 (solid black line) indicates POpeak/kg equal to the mean score of age- and sex-matched healthy controls [Citation32]. A Z-score of −1 (dashed red line) represents POpeak/kg one standard deviation below the age- and sex-specific healthy reference value. POpeak/kg: peak power output (in W) attained during the Steep Ramp Test relative to body weight (in kg); *p < 0.05, **p < 0.01, ***p < 0.001.](/cms/asset/bcfdb2f9-81b6-4a0a-bc60-c80d48809754/idre_a_1641846_f0002_c.jpg)
Figure 3. Different patterns in the course of exercise capacity in pediatric burn patients after discharge. The solid black line indicates the mean peak power output (POpeak/kg) of age- and sex-matched healthy individuals (reference value) [Citation32]. The dashed red line represents one standard deviation below the age- and sex-matched reference value. Four different patterns were distinguished in the course of individual exercise capacity following pediatric burns: Pattern A - reference values of exercise capacity at discharge and at all other assessments (n = 5); Pattern B - low exercise capacity at discharge, (consistent) improvement over time, and recovery to reference values within six months (n = 7); Pattern C - low exercise capacity at discharge, (consistent) improvement over time, but not reaching reference values within six months, i.e. “at risk” (n = 6); Pattern D - low exercise capacity at discharge, no (consistent) improvement over time, and not reaching reference values within six months, i.e. “at risk” (n = 5). In case 6-month follow-up scores were not available, it was estimated whether the participant would reach reference values of exercise capacity or not, based on previous scores and the trend observed during follow-up. POpeak/kg = peak power output (in W) attained during the Steep Ramp Test relative to body weight (in kg); dis = discharge; 6w = 6 weeks after discharge; 3m = 3 months after discharge; 6m = 6 months after discharge.
![Figure 3. Different patterns in the course of exercise capacity in pediatric burn patients after discharge. The solid black line indicates the mean peak power output (POpeak/kg) of age- and sex-matched healthy individuals (reference value) [Citation32]. The dashed red line represents one standard deviation below the age- and sex-matched reference value. Four different patterns were distinguished in the course of individual exercise capacity following pediatric burns: Pattern A - reference values of exercise capacity at discharge and at all other assessments (n = 5); Pattern B - low exercise capacity at discharge, (consistent) improvement over time, and recovery to reference values within six months (n = 7); Pattern C - low exercise capacity at discharge, (consistent) improvement over time, but not reaching reference values within six months, i.e. “at risk” (n = 6); Pattern D - low exercise capacity at discharge, no (consistent) improvement over time, and not reaching reference values within six months, i.e. “at risk” (n = 5). In case 6-month follow-up scores were not available, it was estimated whether the participant would reach reference values of exercise capacity or not, based on previous scores and the trend observed during follow-up. POpeak/kg = peak power output (in W) attained during the Steep Ramp Test relative to body weight (in kg); dis = discharge; 6w = 6 weeks after discharge; 3m = 3 months after discharge; 6m = 6 months after discharge.](/cms/asset/bfc724bd-052c-4d20-bbe3-e616e0510f24/idre_a_1641846_f0003_c.jpg)
Figure 4. Individual Z-scores of exercise capacity at discharge, and 6 weeks, 3 months, and 6 months after discharge. A Z-score of 0 (solid black line) indicates relative peak power output (POpeak/kg) equal to the mean score of age- and sex-matched healthy controls [Citation32]. A Z-score of −1 (dashed red line) represents relative POpeak/kg one standard deviation below the age- and sex-specific healthy reference value. *19 valid assessments of exercise capacity (POpeak), but body weight (kg) was missing in one of them due to the absence of an electronic scale at the time of assessment. POpeak/kg: peak power output (in W) attained during the Steep Ramp Test relative to body weight (in kg); FU: follow-up.
![Figure 4. Individual Z-scores of exercise capacity at discharge, and 6 weeks, 3 months, and 6 months after discharge. A Z-score of 0 (solid black line) indicates relative peak power output (POpeak/kg) equal to the mean score of age- and sex-matched healthy controls [Citation32]. A Z-score of −1 (dashed red line) represents relative POpeak/kg one standard deviation below the age- and sex-specific healthy reference value. *19 valid assessments of exercise capacity (POpeak), but body weight (kg) was missing in one of them due to the absence of an electronic scale at the time of assessment. POpeak/kg: peak power output (in W) attained during the Steep Ramp Test relative to body weight (in kg); FU: follow-up.](/cms/asset/69f1e374-81d0-4d3b-b800-4713c39e20d6/idre_a_1641846_f0004_c.jpg)
Table 2. Potential predictors of exercise capacity following pediatric burns, 6 months after discharge—output from univariate multilevel regression modeling.