Figures & data
Table 1. Background characteristics intervention cohort at baseline, post-intervention, and 2-years follow-up.
Figure 1. Development of paid employment rates within the intervention cohort, and a comparison with national reference data. ^Significant development over time within the intervention cohort. a,bSignificantly differs from baseline within the intervention cohort. *Significantly differs from national reference data.
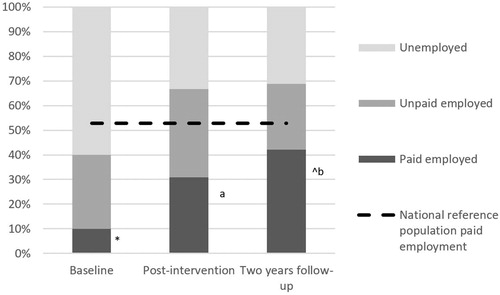
Table 2. Employment rates within the intervention cohort, and a comparison with national reference data.
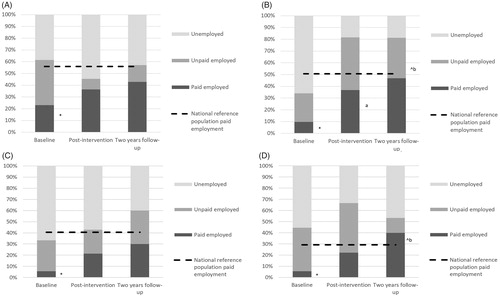
Figure 2. (a) Development of paid employment rates of subgroup no physical limitations within the intervention cohort, and a comparison with national reference data. *Significantly differs from national reference data. (b) Development of paid employment rates of subgroup slight physical limitations within the intervention cohort, and a comparison with national reference data. ^Significant development over time within the intervention cohort. a,bSignificantly differs from baseline within the intervention cohort. *Significantly differs from national reference data. (c) Development of paid employment rates of subgroup moderate physical limitations within the intervention cohort, and a comparison with national reference data. *Significantly differs from national reference data. (d) Development of paid employment rates of subgroup severe physical limitations within the intervention cohort, and a comparison with national reference data. ^Significant development over time within the intervention cohort. bSignificantly differs from baseline within the intervention cohort. *significantly differs from national reference data.