Figures & data
Table
Figure 1. Procedural diagram for the convergent approach: the quantitative and qualitative data were collected separately in the intervention-phase of the trial, before they were analysed separately, and then integrated and discussed for the purpose of a mixed, complementary investigation of the delivery of the BRIDGE program. QI: quality indicators.
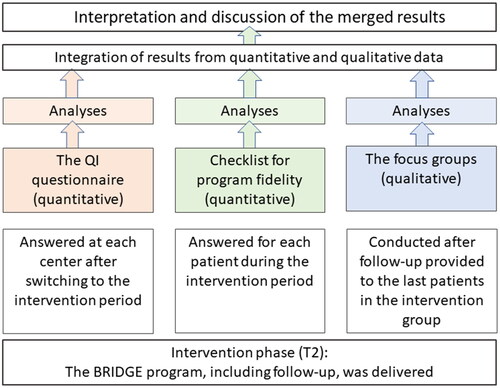
Table 1. Fidelity checklist for optimal delivery of the BRIDGE program.
Figure 2. Fidelity scores for single items in the providers’ checklist for fidelity in the BRIDGE trial. HP: health professionals; rehab: rehabilitation; P: patient; PR: pass rate; FU: follow-up.
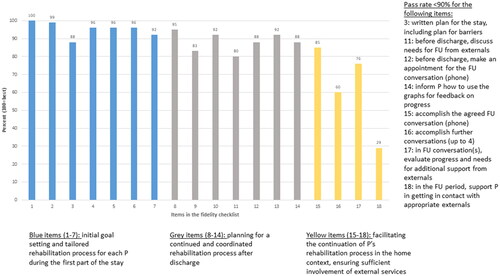
Table 2. Characteristics of the participants and composition of the focus groups.
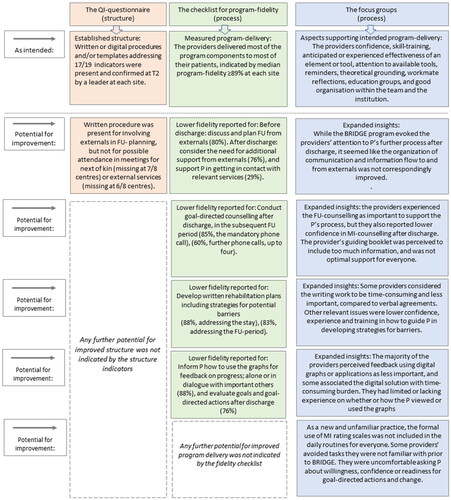
Figure 3. Joint display of intended program delivery confirmed by quantitative and qualitative results, and potentials for improvements suggested by the results from at least one database. FU: follow-up; P: patient; MI: motivational interviewing.