Figures & data
Figure 1. The line graphs show a decrease in frequency of sexualised talk in the three settings after the introduction of the PBS intervention.
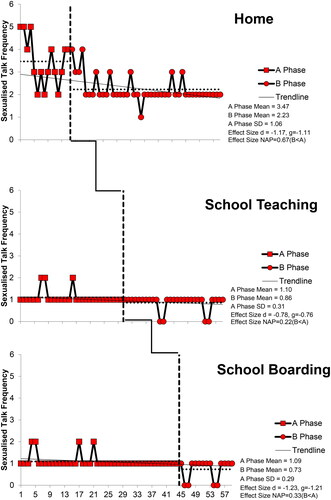
Figure 2. The line graphs show a decrease in the impact ratings in the three settings after the introduction of the PBS intervention. The impact ratings remained low in the School Boarding setting.
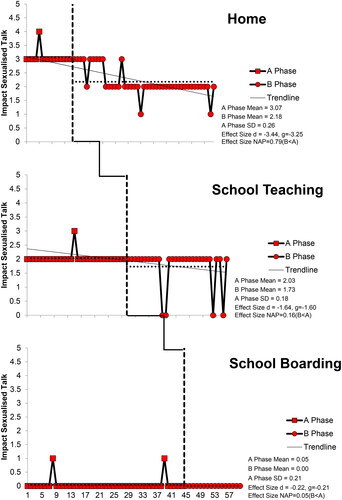
Table 1. The table described the procedure within each phase of the intervention for the baseline and three settings.
Figure 3. The line graph shows a decrease in the frequency of sexualised touch in the home setting after the introduction of the PBS intervention.
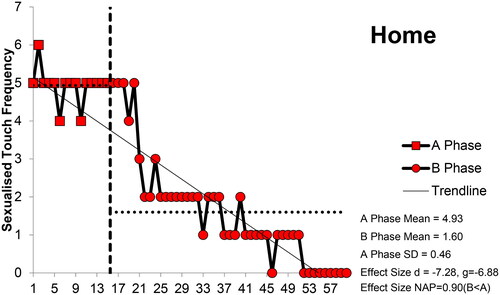
Figure 4. The line graph shows a decrease in the impact ratings within the home setting for sexualised touch after the introduction of the PBS intervention.
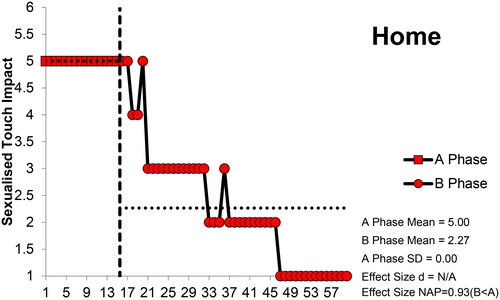
Table 2. The table shows an example of a behaviour observation form to record behaviour and impact ratings.
Table 3. The table shows the GAS goals utilised within the PBS intervention alongside baseline, outcome and improvement scores.
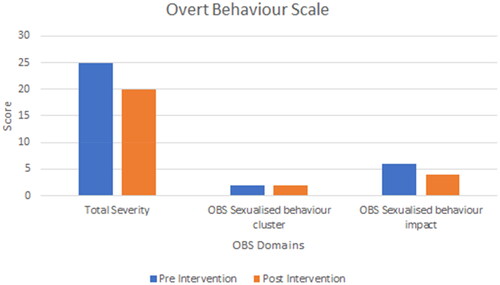
Figure 5. The column chart shows a decrease in Total Severity and Sexualised Behaviour Impact in the Overt Behaviour Scale scores when comparing pre and post intervention measures. Sexualised Behaviour Cluster remains stable due to continued sexualised talk behaviour.