

Figures & data
Figure 1. Distribution of students across class-rank percentiles, by GPA (pct) and SES index (Std). Note: This figure shows SES index and GPA scores variation by rank. GPA and SES index are de-meaned by class-cohort.
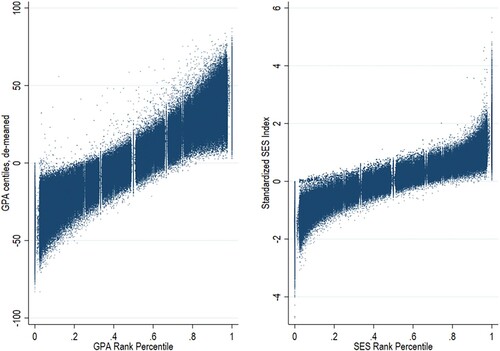
Figure 2. Local polynomial fit of the outcomes by GPA and SES Class-rank percentile.
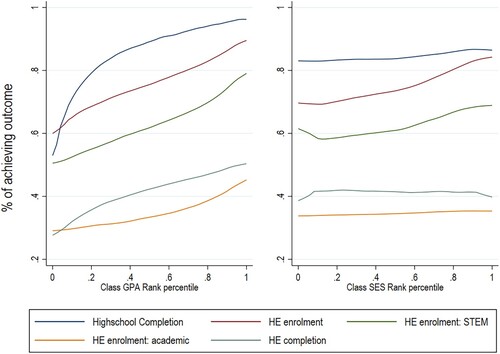
Figure 3. Rank dependent on test score distribution, taken from Murphy and Weinhardt (Citation2020, 2078).
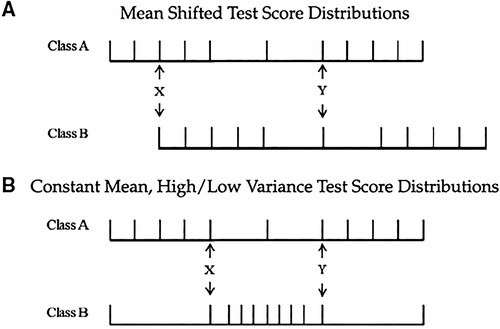
Table 1 . Class academic rank balance tests.
Figure 4. Class-level academic and SES Rank coefficients (probability difference), estimated with fully adjusted linear probability model. 95% confidence intervals shown in error bars. Note: Bars show academic and socioeconomic rank coefficient, which reflect the difference in probability of achieving the outcome between the highest and the lowest ranked student in each class.
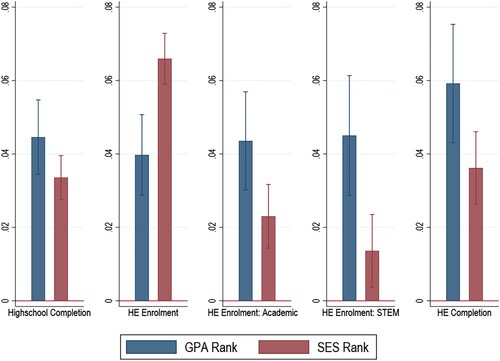
Table 2. Summary of academic and SES class-rank coefficient after linear probability estimations.
Table 3 . Summary of academic school-rank coefficient after linear probability estimations.
Figure 5. Predicted probabilities for class-level academic and SES Rank ventiles, estimated after fully adjusted linear probability model. Note: 95% confidence intervals shown in error bars.
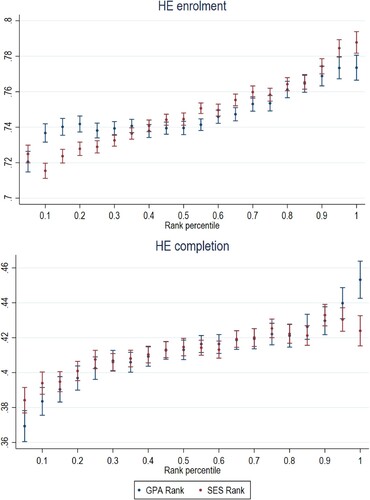
Figure 6. Academic and SES Rank coefficients at class and school level after estimating the fully adjusted model, by sex. Note: 95% confidence intervals shown in error bars.
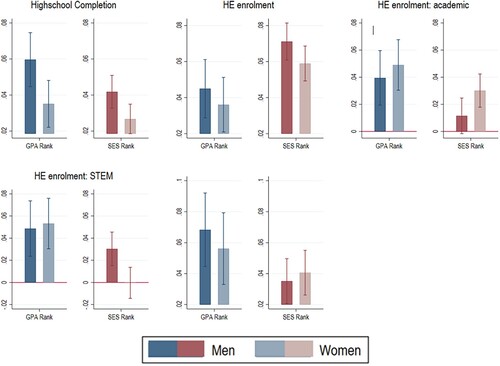
Figure 7. Academic and SES Rank coefficients at class and school level after estimating the fully adjusted model, by school type. Note: Note: 95% confidence intervals shown in error bars.
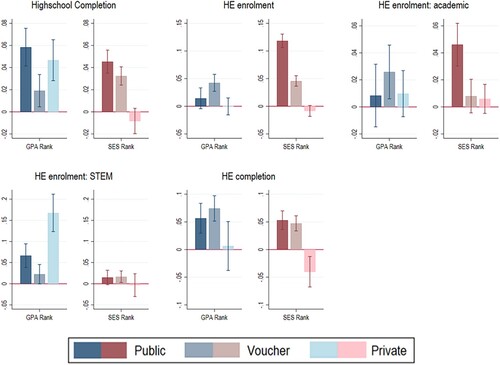
Table 4. Robustness checks: Academic and socioeconomic rank coefficients after adjustment for different functional forms of achievement in Model 3.
Supplemental Material
Download MS Word (1 MB)Data availability statement
This paper uses data from the Chilean Education Minister that can be accessed online at http://datos.mineduc.cl/ and https://informacionestadistica.agenciaeducacion.cl/.

