Figures & data
Table 1. Demographic characteristics of the sample.
Figure 1. Changes from pretest to posttest, where the solid thick line is the average change and the dotted lines are the individual changes.
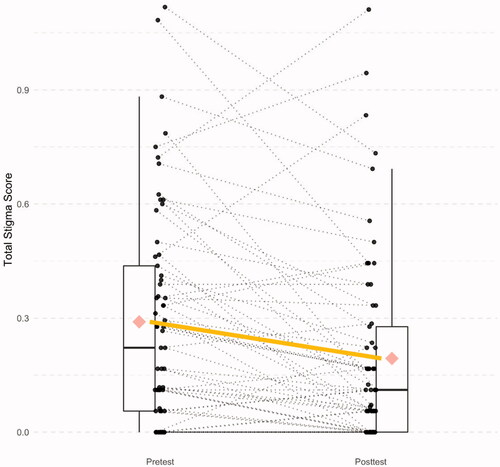
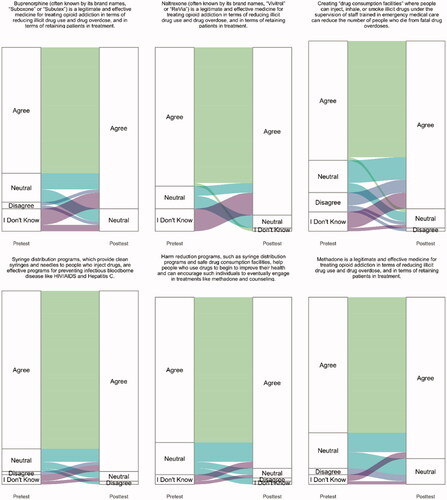
Figure 2. Sankey diagram of the significant changes from pretest to posttest on the individual items.