Figures & data
Figure 1. (A) SDS-gel of the purified G1–59 (lane 1) and a protein ladder (lane 2) with molecular weights as indicated. (B) 2D 1H-15N-HSQC spectrum of G1–59 in 25 mM sodium phosphate buffer (pH 6.5) at 288 K. Backbone and amide assignments (N and Q) are shown for each residue. Signals from side-chain NH2 groups are connected by horizontal lines.
Figure 2. (A) Sections from the overlaid 2D 1H-15N-HSQC spectra of G1–59 in the absence (red) and presence (green) of 1.5 equivalent of unlabeled E18–39. (B) Combined amide (1H) and nitrogen (15N) chemical shift changes ([(Δ1HN)2+(Δ15Nppm/6.51)2]0.5) for G1–59 and E18–38 binding as a function of the amino acid sequence.
![Figure 2. (A) Sections from the overlaid 2D 1H-15N-HSQC spectra of G1–59 in the absence (red) and presence (green) of 1.5 equivalent of unlabeled E18–39. (B) Combined amide (1H) and nitrogen (15N) chemical shift changes ([(Δ1HN)2+(Δ15Nppm/6.51)2]0.5) for G1–59 and E18–38 binding as a function of the amino acid sequence.](/cms/asset/627c0935-7ac8-4ab5-a6af-8a0243f34da0/imbc_a_318510_f0002_b.jpg)
Figure 3. G1–59/E18–38–binding studied by fluorescence correlation spectroscopy. (A) Normalized autocorrelation functions of Atto655 labeled peptide E18–38 by increasing the quantity of subunit G1–59. (B) Concentration-dependent binding of E18–38 to subunit G1–59. The binding constant was calculated by determining the relative bound fraction using a standard autocorrelation two diffusion coefficients normalized triplet model (FCS-LSM software, ConfoCor 3, Zeiss). Best fits yielding the binding constants are represented as fitted line by a non-linear, asymptotic curve fit (see the text).
Figure 4. (A) Far UV-CD spectrum of the peptide E18–38. (B) HN-HN region of the NOESY spectra of E18–38. (C) Connectivity diagram of E18–38. The line thickness reflects the intensities of the NOE connectivities.
Figure 5. Cartoon representation for the NMR structure of the peptide E18–38. (A) Superposition of the five lowest energy structures, (B) average structure showing the angle between the helices and (C) average structure indicating the bend angle of the C-terminal helix with respect the N-terminal helix.
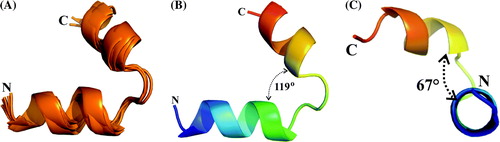
Table I. Summary of structural statistics for five selected structures of E18–38.
Figure 6. The structure of the modeled segment G1–59 (green). The residues shown in stick representation encircled with dotted spheres are the ones that are shown to have binding (M1, V2, S3 and K5; V22, S23, K24, A25 and R26) with the E18–38 peptide. Residues shown in line representation are the ones proposed to be in the interacting region in the docked complex.
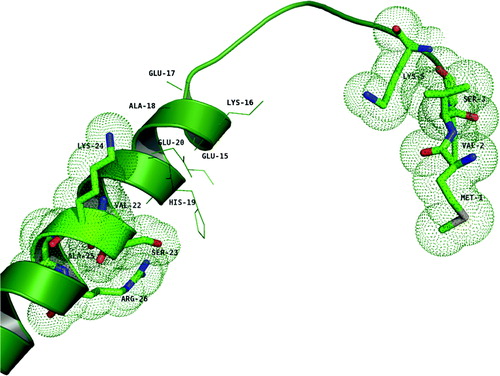
Figure S1. (A) Overlaid 1H/15N-HSQC spectra of G1–59 in the absence (red) and presence (blue) of 1.5 equivalents of E39–233 in 25 mM sodium phosphate buffer (pH 6.8) at 288 K. (B) Overlaid 1H/15N-HSQC spectra of G61–114 in the absence (red) and presence (blue) of 1.5 equivalents of E39–233 in 25 mM sodium phosphate buffer (pH 6.8) at 288 K. (C) Overlaid 1H/15N-HSQC spectra of G1–59 in the absence (red) and presence (yellow) of 1.5 equivalents of E1–18 in 25 mM sodium phosphate buffer (pH 6.8) at 288 K.
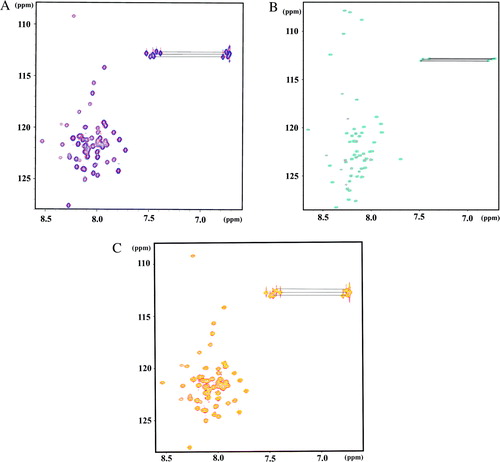
Figure S2. The molecular surface showing the electrostatic potential of the peptide E18–38 drawn in pyMol (DeLano WL [2001] The pyMol Molecular Graphics SystemSan Carlos, CA: DeLano Scientific) that uses Poisson-Boltzmann equation, where the positive potentials are drawn in blue and negative in red. (A) Front view, (B) Back view.
![Figure S2. The molecular surface showing the electrostatic potential of the peptide E18–38 drawn in pyMol (DeLano WL [2001] The pyMol Molecular Graphics SystemSan Carlos, CA: DeLano Scientific) that uses Poisson-Boltzmann equation, where the positive potentials are drawn in blue and negative in red. (A) Front view, (B) Back view.](/cms/asset/52afe9e1-698c-4929-9769-f0a0379da5f1/imbc_a_318510_f0008_b.jpg)