438
Views
13
CrossRef citations to date
0
Altmetric
Papers

The role of sterol rings and side chain on the structure and phase behaviour of sphingomyelin bilayers

, &
Pages 485-497 | Received 11 Jun 2008, Published online: 09 Jul 2009

Figures & data

Figure 1.  DSC thermograms of mixtures of egg SM dispersions containing different sterols with 5:1 (solid line) and 2:1 (dotted line) SM/sterol molar ratios. Samples equilibrated at 10°C were heated to 65°C at a scanning rate of 0.5°C/min−1.
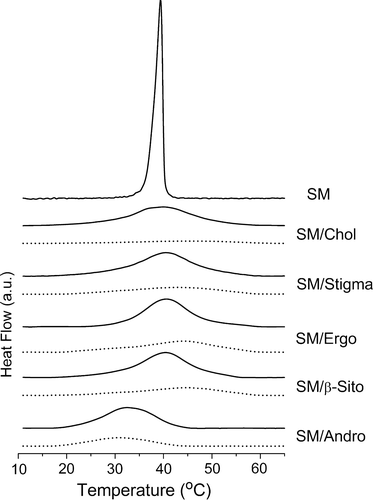
Figure 1.  DSC thermograms of mixtures of egg SM dispersions containing different sterols with 5:1 (solid line) and 2:1 (dotted line) SM/sterol molar ratios. Samples equilibrated at 10°C were heated to 65°C at a scanning rate of 0.5°C/min−1.

Table I.  Temperatures (peak temperature) and phase transition enthalpies of SM and SM/sterol dispersions.

Figure 2.  (A) DSC thermograms of SM/androsterol mixtures containing indicated molar percentages of androsterol at a scanning rate of 0.5°C/min; (B) plots of the peak (•) and onset (▴) temperatures of the DSC endotherms of SM/androsterol as a function of sterol concentration. Mean±SEM are shown for three replicates.
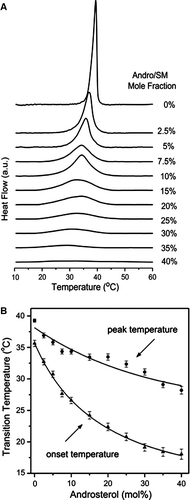
Figure 2.  (A) DSC thermograms of SM/androsterol mixtures containing indicated molar percentages of androsterol at a scanning rate of 0.5°C/min; (B) plots of the peak (•) and onset (▴) temperatures of the DSC endotherms of SM/androsterol as a function of sterol concentration. Mean±SEM are shown for three replicates.

Figure 3.  (A) Small-angle (SAXS) and wide-angle (WAXS) scattering intensity patterns recorded from a binary mixture of SM containing 20 mol% androsterol during a heating scan at 0.55°C/min. The temperature interval of the recorded diffraction patterns was 3°C. Electron micrograph of freeze-fracture replicas showing multilamellar structures of (B) egg SM, quenched from 31°C and (C) egg SM containing 20 mol% androsterol, quenched from 35°C. Bar = 200 nm.
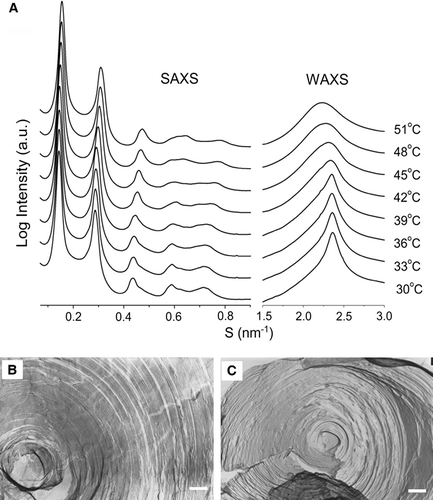
Figure 3.  (A) Small-angle (SAXS) and wide-angle (WAXS) scattering intensity patterns recorded from a binary mixture of SM containing 20 mol% androsterol during a heating scan at 0.55°C/min. The temperature interval of the recorded diffraction patterns was 3°C. Electron micrograph of freeze-fracture replicas showing multilamellar structures of (B) egg SM, quenched from 31°C and (C) egg SM containing 20 mol% androsterol, quenched from 35°C. Bar = 200 nm.

Figure 4.  (A) SAXS/WAXS intensity patterns recorded at 30°C, 33°C, and 36°C from dispersions of egg SM containing 10 mole% and 15 mole% androsterol. Electron micrographs of freeze-fracture replicas prepared from (B) pure egg SM thermally quenched from 31°C and (C) a dispersion of a binary mixture of egg SM containing 20 mole% androsterol thermally quenched from 35°C. Bar = 100 nm.
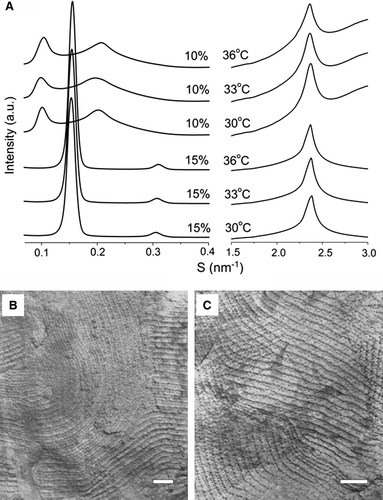
Figure 4.  (A) SAXS/WAXS intensity patterns recorded at 30°C, 33°C, and 36°C from dispersions of egg SM containing 10 mole% and 15 mole% androsterol. Electron micrographs of freeze-fracture replicas prepared from (B) pure egg SM thermally quenched from 31°C and (C) a dispersion of a binary mixture of egg SM containing 20 mole% androsterol thermally quenched from 35°C. Bar = 100 nm.

Figure 5.  (A) Lamellar d-spacing of dispersions of egg SM containing 20, 30, and 40 mole% androsterol plotted as a function of temperature; (B) electron density profiles for 2:1 SM:androsterol and 2:1:0.3 SM:androsterol:glucosylceramide in excess water at 36°C; (C) the WAXS patterns of egg SM with 30 and 35 mole% androsterol, respectively; (D) the relationship between crystal peaks observed in the WAXS region in 35 mol% SM/androsterol and pure androsterol.
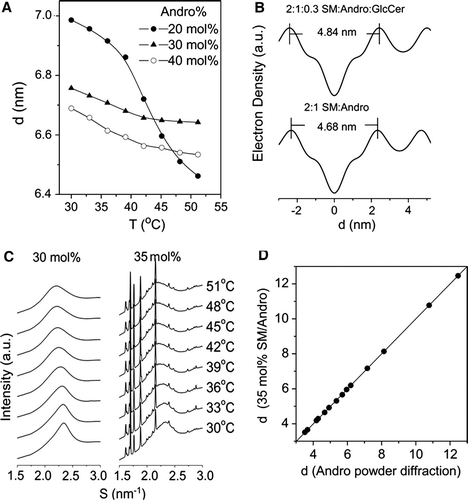
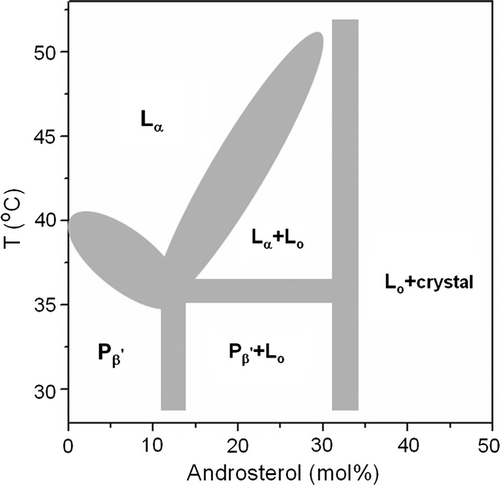
Figure 5.  (A) Lamellar d-spacing of dispersions of egg SM containing 20, 30, and 40 mole% androsterol plotted as a function of temperature; (B) electron density profiles for 2:1 SM:androsterol and 2:1:0.3 SM:androsterol:glucosylceramide in excess water at 36°C; (C) the WAXS patterns of egg SM with 30 and 35 mole% androsterol, respectively; (D) the relationship between crystal peaks observed in the WAXS region in 35 mol% SM/androsterol and pure androsterol.
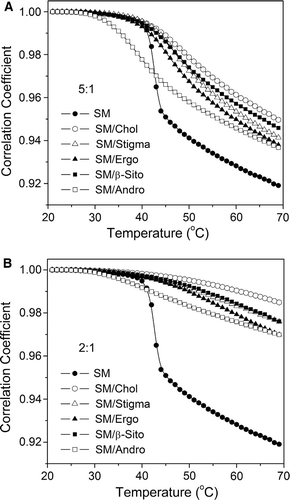
Figure 6.  A partial phase diagram sketch of egg SM/androsterol system in excess water. See text for details.

Figure 6.  A partial phase diagram sketch of egg SM/androsterol system in excess water. See text for details.

Figure 7.  Correlation coefficient curves of dispersions of SM and (A) 5:1 SM/sterols, and (B) 2:1 SM/sterols, during the heating process.

Figure 7.  Correlation coefficient curves of dispersions of SM and (A) 5:1 SM/sterols, and (B) 2:1 SM/sterols, during the heating process.

Reprints and Corporate Permissions

Please note: Selecting permissions does not provide access to the full text of the article, please see our help page How do I view content?

To request a reprint or corporate permissions for this article, please click on the relevant link below:

Academic Permissions

Please note: Selecting permissions does not provide access to the full text of the article, please see our help page How do I view content?

Obtain permissions instantly via Rightslink by clicking on the button below:

If you are unable to obtain permissions via Rightslink, please complete and submit this Permissions form. For more information, please visit our Permissions help page.