Figures & data
Figure 1. Detection of UCP2 changes in renal tissue by Western Blotting. AB: Downregulation of UCP2 protein expression after IR. C: Downregulation of UCP2 gene expression after IR. (The internal reference is GAPDH. The greyscale value of each group is compared with the internal reference, and the obtained result is compared with the sham group. In each group of six mice, the data are expressed as the mean ± standard deviation (±S). *p < 0.01, compared with sham.).
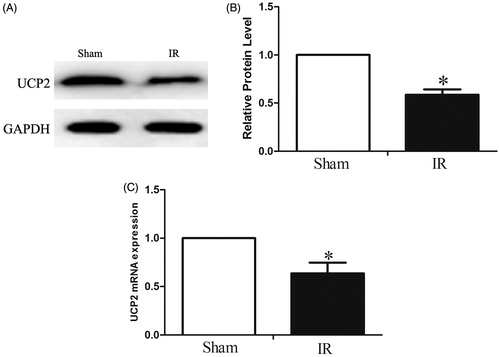
Figure 2. UCP2−/− induced renal ischaemia reperfusion injury (IRI) aggravation. A, B: ELISA determination of serum creatinine and BUN in 3 groups. (For the six mice in each group, data are expressed as the mean ± standard deviation (±S). The upper panel * is p < 0.01, compared with sham; ** is p < 0.01, compared with IR group.) C: Pathological changes in the kidneys of mice in each group after ischaemia-reperfusion.
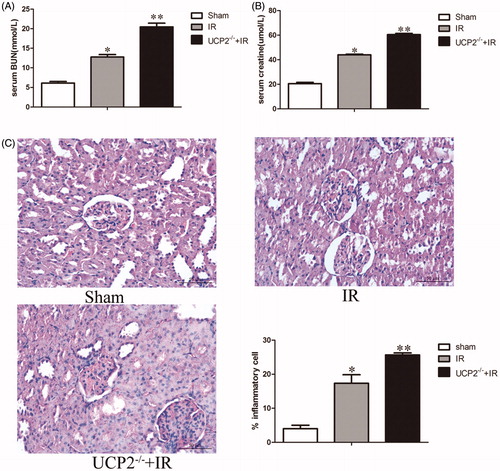
Figure 3. (A) Immunofluorescence determination of ROS expression in the kidneys of 3 groups. (Six mice in each group, data are expressed as the mean ± standard deviation (±S). The upper panel * is p < 0.01, compared with sham; ** is p < 0.01, compared with the IR group, × 200) (B) Immunohistochemical detection of apoptotic cell content in the three groups. (The black arrows in the figure indicate areas of apoptosis-positive cells; in each group six mice, the data are expressed as the mean ± standard deviation (±S). The upper panel* is p < 0.01, compared with sham; ** is p < 0.01, compared with UCP2-/-+IR group. ×200) (C) Detection of cleaved caspase-3 expression in the kidneys by Western blotting. (The internal reference is GAPDH. The greyscale value of each group is compared with the internal reference, and the obtained result is compared with the sham group. In each group of six mice, the data are expressed as the mean ± standard deviation (±S). *p < 0.01, compared with sham; **p < 0.01 compared to IR group.).
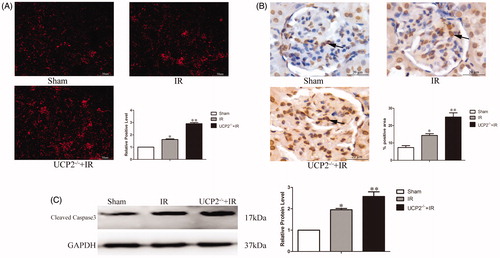
Figure 4. Detection of NFκB pathway changes in renal tissue by Western blotting. AC: UCP2 prevents IRI by inhibiting cytoplasmic IκB and IKK phosphorylation. BD: UCP2 inhibits NFκB. (The internal references are GAPDH (cytoplasm) and histone H3 (nucleus). The greyscale value of each group is compared with the internal reference, and the obtained result is compared with the sham group. In each group of six mice, the data are expressed as the mean ± standard deviation (±S). *p < 0.01, compared with sham; **p < 0.01 compared to IR group).
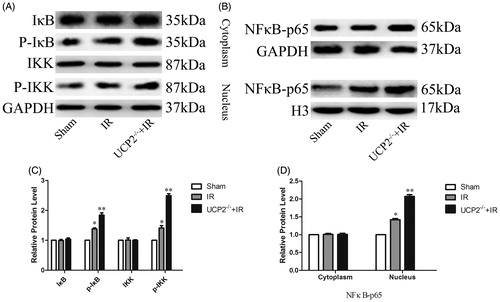
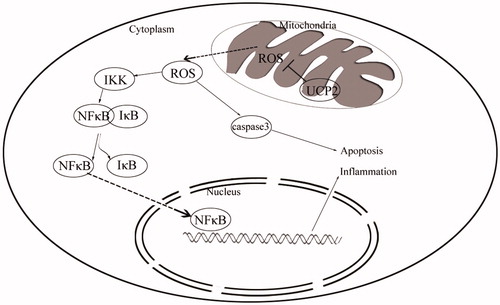
Figure 5. Simplified diagram of the protective mechanism by which UCP2 alleviates IRI.