Figures & data
Table I. Bilayer width (BW) of different synthetic PCs and variation in the distance of Trp6 in γM4-Trp6 to the membrane interface (i.e., insertion depth, SHF) as a function of bilayer thickness.
Figure 1. Normalized fluorescence intensity of γM4-Trp6 at 328 nm in reconstituted liposomes of different bilayer width with SLPCs. Trp6 in reconstituted liposomes of DLPC (____), DOPC (_ _ _ _) and DMPC at 11°C (......) with or without SLPCs having a nitroxide group at different depths (positions 5, 7, 10 and 12 of the phospholipid acyl chain). The fluorescence intensity values obtained in the presence of SLPC were normalized with respect to the corresponding fluorescence intensity value in the absence of spin probe (100%).
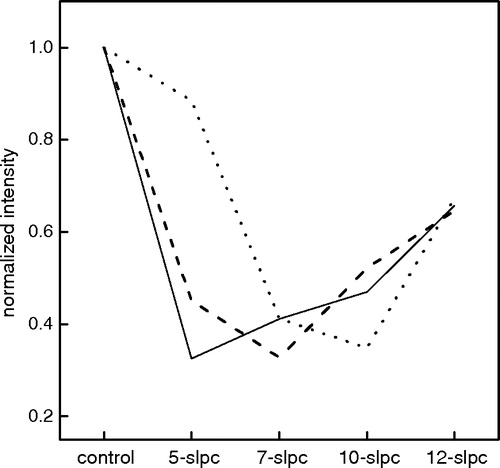
Figure 2. (a) γ-M4-Trp6 insertion depth (SHF) as a function of hemilayer width. From left to right the points correspond to the experimentally measured position of γM4-Trp6 peptide reconstituted in DLPC, DMPC at 37°C, DPPC at 52°C, DOPC, DMPC at 12°C, and DPPC at 30°C. Inset: Q-ratio* values as a function of hemilayer width. Each point corresponds to the average±SD of at least four independent determinations. (b) Laurdan GP (♦, ▪, •, ▴) and anisotropy (⋄, □, ○, ▵) as a function of the depth of insertion of Trp6 (SHF) in liposomes of DMPC with different amounts of Chol. From left to right: 0% (♦, ⋄), 15% (▪,□) and 30% (•,○) Chol in DMPC liposomes. Experiments were carried out at 37°C to ensure that DMPC was in the liquid-crystalline phase. The same parameters are presented for DMPC without Chol at 11°C (gel phase, ▴, ▵) for comparison (SHF=6.04).
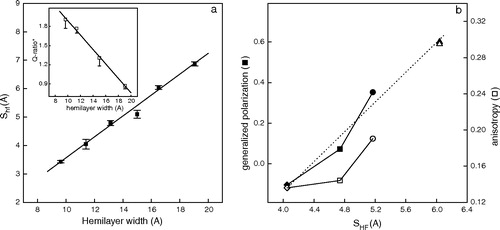
Figure 3. (a) Schematic diagram indicating the different parameters taken into account to calculate the helix chain tilt parameters (HCTP) for the γ-M4-Trp6 peptide as a linear α-helix in the bilayer (see text for details). (b) Experimental and calculated tilt parameters as a function of bilayer width. From left to right the experimental (HCTPexp, ▪) and calculated (HCTP25, □; HCTP21, ○) tilt parameter points correspond to values of γ-M4 peptide reconstituted in DLPC, DMPC at 37°C, DPPC at 52°C, DOPC, DMPC at 12°C, and DPPC at 30°C, respectively. HCTPsim corresponds to the MD simulations: I) γM4 in POPC at 27°C (▾), II) γM4 in DPPC at 50°C (▴), and III) γM4 helix modeled with the rest (γM1-3) of the helix bundle in DPPC at 50°C (♦). HCTP obtained for the γM4 of the whole AChR in native membranes of T. californica (•, arrow). This Figure is reproduced in colour in Molecular Membrane Biology online.
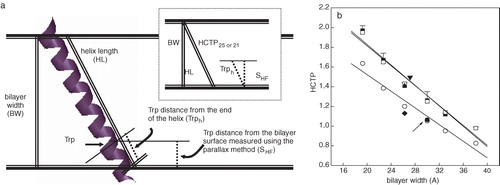
Figure 4. Changes of the angle (ΔT) between the axis of γM4 and the Z-axis along each 30 ns trajectory. Three MD simulations were analyzed: I)? γM4 in POPC at 27°C (____), II) γM4 in DPPC at 50°C (......), and III) γM4 helix modeled with the γM1-3 bundle in DPPC at 50°C (---). The centers of mass of residues 5–8 and 20–23 are set as the top and bottom of the axis of the γM4 helix, respectively.
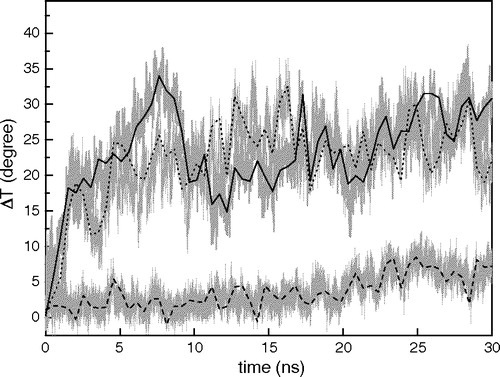
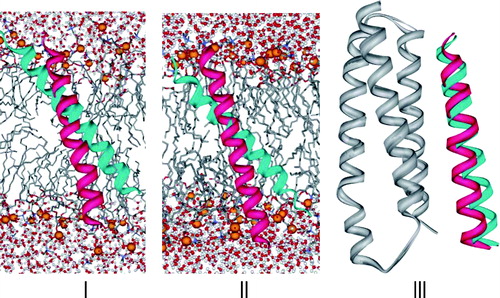
Figure 5. Ribbon snapshots of γM4 along the 30 ns trajectory. Two snapshots are presented: 0 ns (red) and 30 ns (cyan) for the three simulations: I) γM4 in POPC at 27°C, II) γM4 in DPPC at 50°C, and III) γM4 with the γM1-3 bundle (grey) in DOPC at 50°C. In I and II the phosphorus atoms of the phospholipid polar headgroups are shown in space-filling format (orange) the other atoms of the lipid are represented as sticks, water molecules are displayed as balls (red) and sticks, and the front half of the bilayer lipids is not shown to facilitate the visualization of γM4 within the core of the lipid bilayer. The lipid moiety was not included in III for the sake of clarity.