Figures & data
Figure 1. (A) Structures of α/β-peptides I and II. (B) Schematic views of α/β-peptides I and II in idealized 14/15-helical conformations, viewed along the helix axis (these images are analogous to “helical wheel” diagrams for α-peptides). These perspectives show that when the α/β-peptides are helical, I is expected to be globally amphiphilic while II is not.
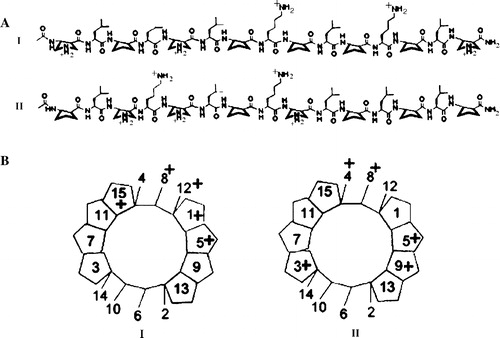
Figure 2. Comparison of reverse phase high pressure liquid chromatography (RP-HPLC) retention profiles of α/β-peptides I and II. Conditions: C8-silica analytical column, linear gradient of acetonitrile in water (with 0.1% TFA) from 20 to 60% over 40 min (the gradient starts upon elution of the solvent front, which occurs approximately 5 min after injection). Ordinate shows absorbance at 220 nm.
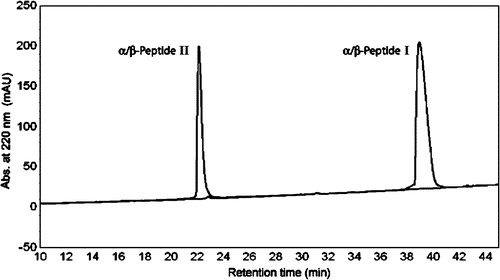
Figure 3. Leakage of aqueous contents measured by the ANTS/DPX assay at 37°C of 50 µM LUVs. The concentration of peptide used (2.5–10 µM) is shown on the Figure. (A) LUVs of DOPE: DOPG (2:1) with α/β-peptide I (left panel) or α/β-peptide II (right panel). (B) LUVs of DOPC: DOPG (2:1) with α/β-peptide I (left panel) or α/β-peptide II (right panel). (C) LUVs of DOPG: DOPE: DOPC (70:12:18) with α/β-peptide I (left panel) or α/β-peptide II (right panel). (D) LUVs of DOPC with α/β-peptide I (left panel) or α/β-peptide II (right panel).
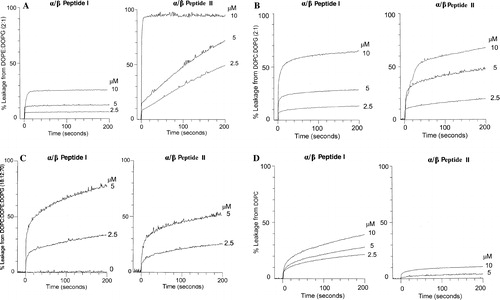
Figure 4. 31P NMR as a function of temperature with DOPE: DOPG (2:1) as control (left column) and in the presence of α/β-peptide I (middle column) or α/β-peptide II (right column). Each sample contained DOPE: DOPG (2:1) with or without 10 mol% of α/β-peptide in 200 µl Pipes buffer pH 7.4.
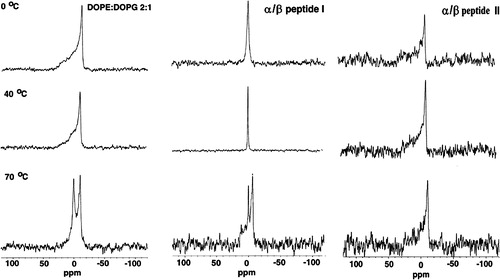
Figure 5. One-dimensional diffraction patterns of DOPE: DOPG (2:1) measured at 25°C (No Peptide) and incorporating 10 mole% of either α/β-peptide I (middle panel) or α/β-peptide II (bottom panel), plotted against scattering vector q. Depression in the center of the pattern is from the beam stop. Lipid alone shows two orders of lamellar diffraction. Addition of peptide I results in loss of the diffraction peaks, while peptide II causes a broadening and sharpening of the diffraction pattern corresponding to a small spacing.
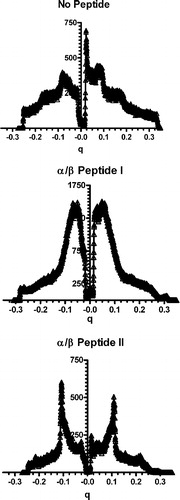
Figure 6. Freeze fracture micrographs of DOPE: DOPG (2:1) incorporating 10 mole% of either (A) α/β-peptide I or (B) α/β-peptide II. Scale bars represent 250 nm.
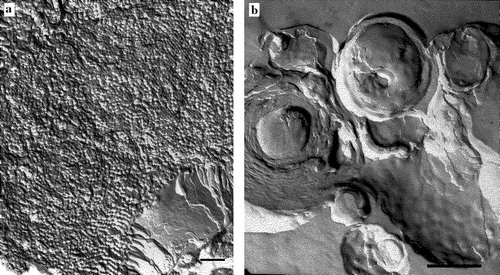
Figure 7. Binding to LPS (top) or LTA (bottom) as a function of concentration of either α/β-peptide I or α/β-peptide II, at 25°C was determined by displacement of dansyl polymyxin B. The fluorescence intensity obtained at 495 nm (excitation at 430 nm) is expressed relative to that of LPS-dansyl polymyxin complex in absence of α,β-peptide.
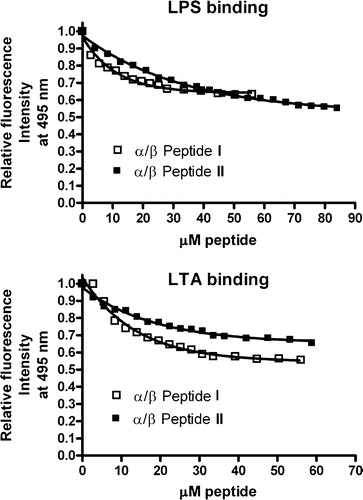
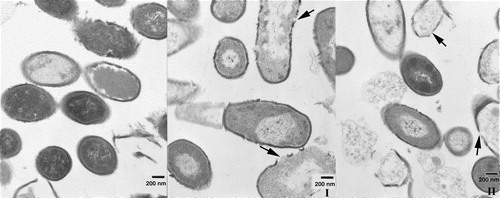
Figure 8. Transmission electron microscopy of thin sections of fixed E. coli bacteria in the presence of α/β-peptide I and α/β-peptide II, at 25,000× magnification. Bars correspond to 200 nm. (A) Left, untreated E.coli bacteria, after 5 min incubation at 37°C. Middle, bacteria treated with low concentrations (18 µg/ml) of α/β-peptide II after 5 min incubation. Membrane alteration with loss of contents is already visible. Right, higher concentrations (72 µg/ml) of α/β-peptide II after 5 min incubation at 37°C; dramatic changes in morphology are present, i.e., blebbing, loss of internal contents, membrane joining, etc. (B) Two images each at 45 min incubation, with either α/β-peptide I (left) or α/β-peptide II (right) (72 µg/ml). These images show the progression of the membrane damage observed in A. Arrows mark regions where α/β-peptide I causes separation of inner and outer membranes (left side) or where α/β-peptide II results in adherence of the two membranes (right side). Regions highlighted by arrows are also shown in C in an expanded form. (C) Expanded view (∼10×) of sections of above four images at 45 min incubation shown in 8B.
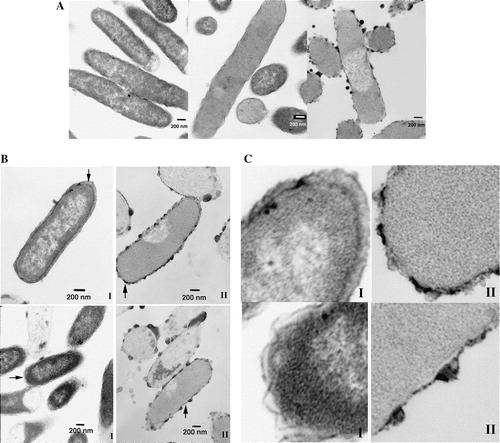
Figure 9. Transmission electron microscopy of thin sections of fixed B. subtilis incubated for 45 min at 37°C. Magnification 25,000×. Bars correspond to 200 nm. Left, without any additions. Middle, incubated in the presence of 72 µg/ml of peptide I. Right, incubated in the presence of 72 µg/ml of peptide II. While live bacteria predominate in the control, non-viable ones predominate in the presence of either peptide. The bacterial membrane is compromised in the same way by the presence of peptide, where leakage of internal contents is visible. Arrows mark regions of membrane rupture.