Figures & data
Figure 1. C-terminal fusion of fluorescent proteins does not change the potency and the TNP-ATP induced inhibition of αβ-meATP mediated P2X3 receptor currents. (A) Recombinant plasmids used for the generation of transformant HEK293 cells. Upper panel: pP2X3-ECFP was constructed by an in-frame fusion of the ECFP gene with the P2X3 gene. The STOP codon and the entire downstream DNA region of the P2X3 gene has been deleted. Middle panel: pP2X3-DsRed2 was generated similarly, fusing the DsRed2 gene with P2X3 retaining the same reading frame. The STOP codon and downstream sequences of the P2X3 gene have also been eliminated in this construct. Lower panel: For the construction of HEK293 cells expressing separate P2X3 and ECFP genes, we used two transfer plasmids, pP2X3 and pECFP-N1. pP2X3 was generated by equipping the full-length P2X3 cDNA sequence with the constitutive human cytomegalovirus immediate early 1 promoter/enhancer, transcription termination and polyadenylation sequences (pa). (B) Micrographs of fluorescent fusion protein bearing HEK293 cells. Depicted are bright field (left panel) and fluorescence (right panel) pictures of P2X3-ECFP (upper part) or P2X3-DsRed2 (lower part) expressing cells. The superimposed images (middle panel) allow us to discriminate between fusion protein expressing and non-transformant HEK293 cells, with the latter serving as a negative control. The fluorescence pictures were taken with a FITC filter combination (B-2A, Nikon) for ECFP, and a TRITC filter combination (Nikon) for DsRed2 constructs. The scale bar represents 20 µm. (C) Unchanged potency of αβ-meATP at P2X3-DsRed2 and P2X3-ECFP receptors. Concentration–response relationships were measured for HEK293 cells expressing wt-P2X3 (circles), P2X3-DsRed2 (squares), and P2X3-ECFP (triangles) constructs. Increasing concentrations of αβ-meATP (1, 3, 10, 30, 100 µM) were applied successively through pressure application. Peak amplitudes of resulting whole cell currents (Vhold= − 80 mV) were normalized to the corresponding 30 µM response, averaged (n=7–10 for each construct), and plotted against the logarithm of agonist concentration. Applications to individual cells were separated by 6 min intervals. Symbols represent mean and SD. EC50 values and Hill coefficients were determined by fitting the data to a Hill equation; the parameters of the three receptor constructs were not different (). (D) Inhibition of αβ-meATP mediated receptor currents by TNP-ATP. Application of TNP-ATP (1 µM, 6 sec pre-application) to wt-P2X3 (D1), P2X3-ECFP (D2), and P2X3-DsRed2 (D3) in HEK293 cells reversibly inhibited receptor currents evoked by αβ-meATP (10 µM, 3 sec) (Vhold= − 80 mV). Typical responses before, during, and after washout of the antagonist are illustrated for each construct. Control currents of the three constructs were scaled to the wt-P2X3 response. Open bars indicate application of the agonist or the agonist/antagonist cocktail, respectively. The insets show control and recovery traces with higher time resolution. After washout, wt-P2X3 responses displayed recovery to 114%, while currents through P2X3-ECFP and P2X3-DsRed2 recovered to 86 and 81%, respectively. Inhibition by TNP-ATP was almost complete in all three cases.
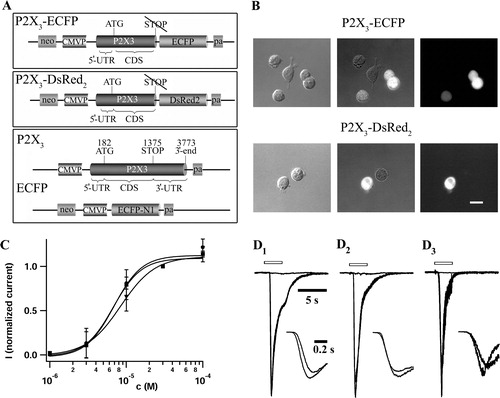
Table I. Properties of P2X3 receptor constructs.
Figure 2. Analysis of reversal potentials of currents through P2X3 receptor constructs. (A) Pressure application of αβ-meATP (30 µM, 3 sec, open bars) induced receptor currents in HEK293 cells expressing wt-P2X3 (left), P2X3-ECFP (middle) and P2X3-DsRed2 (right). Responses were successively elicited at −20 and +20 mV (6 min intervals) and scaled to the −20 mV trace of the wt construct. The reversal potentials, determined by linear interpolation of peak currents obtained at −20 and the +20 mV, amounted to 3.6, 8.3, and 4.6 mV for wt-P2X3, P2X3-ECFP, and P2X3-DsRed2, respectively. (B) Voltage ramps (−30 to +30 mV, duration 200 ms, every 350 ms for 7 sec, Vhold= − 80 mV) were applied to a cell expressing P2X3-DsRed2. The upper panel illustrates a control recording (no agonist), the middle trace the response (Imax=943 pA) to pressure application of αβ-meATP (30 µM, 3 sec, indicated by the bar). Receptor currents were isolated subtracting the control trace from the response (bottom). Note that the slope of the ramps became steeper during receptor activation. This cell had a reversal potential of 7.1 mV. (C) Current voltage curves were plotted over time (waterfall plot; time runs from front to the back (0–7 sec), voltage from left to right (−30 to +30 mV) and current bottom-up. (D) Typical I/V curves, obtained at maximal receptor conductance, are given for each construct. The lower panel shows the reversal potentials at higher magnification. Currents reversed at 7.6, 7.5, and 7.1 mV for wt-P2X3, P2X3-ECFP, and P2X3-DsRed2, respectively.
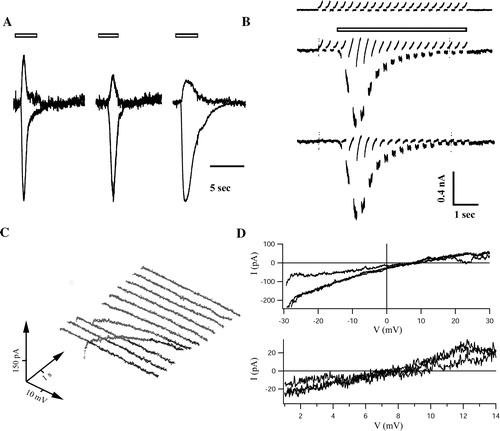
Figure 3. Gating properties of P2X3 receptor constructs. (A) UV flash liberation of ATP from DMNPE-caged-ATP (100 µM) elicited fast inward currents in a cell expressing P2X3-DsRed2. The trace represents the mean of normalized responses recorded from 6 cells. (B) The rising phase of normalized, averaged UV-flash induced currents is given for wt-P2X3 (n=8), P2X3-ECFP (n=4), and P2X3-DsRed2 (n=6) with higher time resolution. Traces were superimposed to facilitate comparison of activation kinetics. (C) Pressure application of αβ-meATP (30 µM, 20 sec, open bars) elicited inactivating inward currents in a cell expressing P2X3-DsRed2. The trace represents the mean of normalized responses recorded from 7 cells. (D,E) To visualize fast and slow components of receptor desensitization, normalized mean currents are shown at different time scaling. Superposition of wt-P2X3 (n=6), P2X3-ECFP (n=5), and P2X3-DsRed2 (n=7) responses revealed that the currents declined by almost 80% within the first 500 ms (D). Neither the fast nor the slow component of desensitization (E) differed among the three P2X3 constructs.
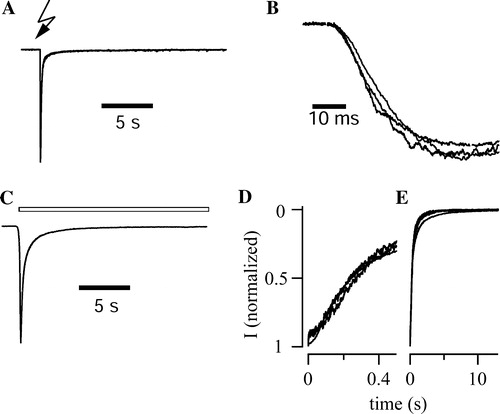
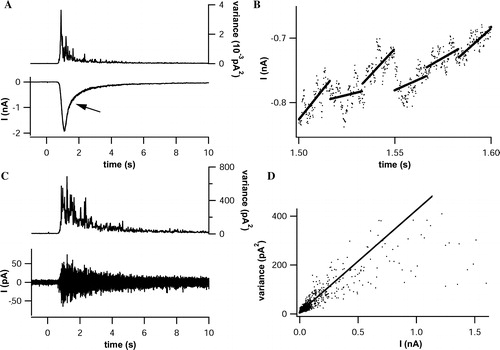
Figure 4. Single channel analysis through non-stationary noise analysis. (A) Pressure application of αβ-meATP (30 µM, 20 sec, lower panel) elicited inward currents in a cell expressing P2X3-DsRed2 (Vhold= − 80 mV). The current trace was sectioned into 16.8 ms intercepts, corresponding to 100 data points. Variances and mean amplitudes were calculated for each interval, and variances were plotted against time (upper panel). (B) Linearization of the current trace was achieved by subtracting the linear fit (continuous lines) from the original trace (scatterplot) for each intercept. Exemplarily shown is a 100 ms segment of the trace, indicated by the arrow in (A). (C) Background and receptor-mediated current noise is visible after linearization (lower panel). Variances (upper panel) were calculated for each intercept. (D) Pairs of mean currents taken from (A) and corresponding variances obtained from (C) were sorted by amplitudes and plotted. The single channel conductance (7.65 pS) was estimated as the initial slope, determined by linear regression (continuous line) of the scatterplot.