Figures & data
Figure 1. Primary structure of rabbit PAT1. The amino acid sequence of rabbit PAT1 is aligned with human PAT1 (gi:41352721). The regions of sequence identity and similarity between the two proteins are indicated by shading.
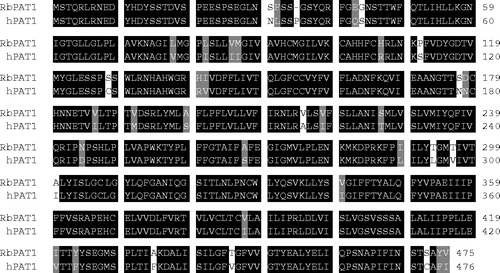
Figure 2. Expression of PAT1 and IMINO mRNA in rabbit tissues. Products of PCR using primers specific for PAT1 (739bp), IMINO (539bp) and G3PDH (983bp) and cDNA from multiple rabbit tissues. Lanes are: M, 100 bp marker; 1, heart; 2, liver; 3, kidney; 4, duodenum; 5, jejunum; 6, ileum; 7, colon; 8–12, brain (8, cerebellum; 9, hippocampus; 10, striatum; 11, frontal cortex; 12, parietal cortex). PCR products were separated on a 1% agarose gel and were visualized by ethidium bromide staining. The arrows indicate the position of the 500 bp marker in lane M on each gel.
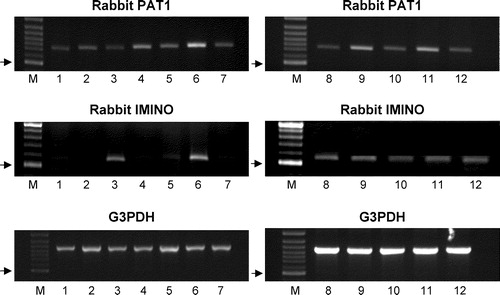
Figure 3. Influence of Na+ and H+ gradients on rabbit PAT1 cDNA-mediated amino acid uptake. Uptake of [3H]proline (5 µM), [3H]glycine (5 µM), [3H]alanine (5 µM) and [3H]MeAIB (20 µM) was measured for 5 min in HRPE cells transfected either with the empty pSPORT1 vector (open bars) or rabbit PAT1 cDNA (filled bars). (a) The influence of extracellular Na+. Uptake was measured at extracellular pH 7.5 in the presence of a Na+-containing buffer (containing 140 mM NaCl). (b) & (c) The influence of a pH or H+ gradient. Uptake was measured at extracellular pH 5.0 in a Na+-free buffer (140 mM NMDGCl replacing 140 mM NaCl). Results are mean±SEM (n=6). **p < 0.01 rabbit PAT1 versus pSPORT.
![Figure 3. Influence of Na+ and H+ gradients on rabbit PAT1 cDNA-mediated amino acid uptake. Uptake of [3H]proline (5 µM), [3H]glycine (5 µM), [3H]alanine (5 µM) and [3H]MeAIB (20 µM) was measured for 5 min in HRPE cells transfected either with the empty pSPORT1 vector (open bars) or rabbit PAT1 cDNA (filled bars). (a) The influence of extracellular Na+. Uptake was measured at extracellular pH 7.5 in the presence of a Na+-containing buffer (containing 140 mM NaCl). (b) & (c) The influence of a pH or H+ gradient. Uptake was measured at extracellular pH 5.0 in a Na+-free buffer (140 mM NMDGCl replacing 140 mM NaCl). Results are mean±SEM (n=6). **p < 0.01 rabbit PAT1 versus pSPORT.](/cms/asset/a57c5e3c-d4d9-4420-babb-c3fc27dd7368/imbc_a_142160_f0003_b.jpg)
Figure 4. pH-dependent proline uptake via rabbit PAT1. [3H]Proline uptake (10 µM) into vector-transfected (open squares) or rabbit PAT1 cDNA-transfected (filled squares) HRPE cells was measured for 5 min in the absence of Na+ over the extracellular pH range 5.0–7.5. The pH of the uptake buffer was varied by adjusting the concentrations of MES, HEPES and Tris base. Results are mean±SEM (n=6).
![Figure 4. pH-dependent proline uptake via rabbit PAT1. [3H]Proline uptake (10 µM) into vector-transfected (open squares) or rabbit PAT1 cDNA-transfected (filled squares) HRPE cells was measured for 5 min in the absence of Na+ over the extracellular pH range 5.0–7.5. The pH of the uptake buffer was varied by adjusting the concentrations of MES, HEPES and Tris base. Results are mean±SEM (n=6).](/cms/asset/46a3eb5b-a25d-4fec-9fab-3ccaefc8bc25/imbc_a_142160_f0004_b.jpg)
Figure 5. Saturation kinetics of rabbit PAT1-mediated proline uptake. Proline uptake (0.1–10 mM) was measured at pH 5 in the absence of extracellular Na+ in cells transfected either with the empty pSPORT1 vector or rabbit PAT1 cDNA. Uptake represents the rabbit PAT1-specific uptake (calculated by subtraction of uptake in the vector-only transfected cells from uptake in the rabbit PAT1 cDNA-transfected cells). Inset, Eadie–Hofstee plot where V (uptake rate) is plotted against V/S (uptake rate/proline concentration). Results are mean±SEM (n=6).
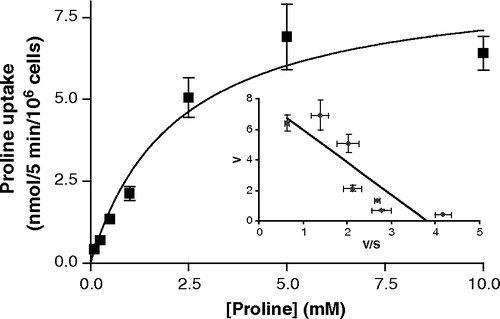
Figure 6. Effects of other amino acids on rabbit PAT1-mediated [3H]proline uptake. [3H]Proline uptake (10 µM, pH 5, Na+-free conditions) into vector-transfected or rabbit PAT1 cDNA-transfected HRPE cells in the presence or absence of unlabeled amino acids (all 5 mM). Results are mean±SEM (n=6). ***p<0.001 rabbit PAT1 versus pSPORT.
![Figure 6. Effects of other amino acids on rabbit PAT1-mediated [3H]proline uptake. [3H]Proline uptake (10 µM, pH 5, Na+-free conditions) into vector-transfected or rabbit PAT1 cDNA-transfected HRPE cells in the presence or absence of unlabeled amino acids (all 5 mM). Results are mean±SEM (n=6). ***p<0.001 rabbit PAT1 versus pSPORT.](/cms/asset/4857d90f-e84b-4398-825a-9a56970843d3/imbc_a_142160_f0006_b.jpg)
Figure 7. Effect of alanine on rabbit PAT1-mediated proline uptake. Rabbit PAT1-specific [3H]proline uptake (5 µM, pH 5, Na+-free conditions) in HRPE cells was measured in the presence and absence of alanine (0.01–10 mM). Results are mean±SEM (n=3).
![Figure 7. Effect of alanine on rabbit PAT1-mediated proline uptake. Rabbit PAT1-specific [3H]proline uptake (5 µM, pH 5, Na+-free conditions) in HRPE cells was measured in the presence and absence of alanine (0.01–10 mM). Results are mean±SEM (n=3).](/cms/asset/420063a8-17a4-4f93-a5e0-4e1ae66b839f/imbc_a_142160_f0007_b.jpg)
Figure 8. Influence of H+ (a) and Na+ (b) gradients on proline uptake into rabbit renal brush-border membrane vesicles (BBMV). Time-dependent [3H]proline (10 µM) uptake into rabbit renal BBMV: (a) in the presence (extravesicular pH 6.0, intravesicular pH 8.4, Na+-free conditions) or absence (Control, extravesicular pH 8.4, intravesicular pH 8.4, Na+-free conditions) of an inwardly directed H+ gradient; or (b) in the presence (extravesicular 150 mM NaCl, intravesicular 300 mM mannitol) or absence (Control, extravesicular 300 mM mannitol, intravesicular 300 mM mannitol) of a Na+ gradient (both extra- and intravesicular pH 7.5). The Na+ gradient experiments (b) were performed in the presence of 10 mM alanine in the extravesicular uptake solution to inhibit any PAT1-mediated uptake. Results are mean±SEM (n=4).
![Figure 8. Influence of H+ (a) and Na+ (b) gradients on proline uptake into rabbit renal brush-border membrane vesicles (BBMV). Time-dependent [3H]proline (10 µM) uptake into rabbit renal BBMV: (a) in the presence (extravesicular pH 6.0, intravesicular pH 8.4, Na+-free conditions) or absence (Control, extravesicular pH 8.4, intravesicular pH 8.4, Na+-free conditions) of an inwardly directed H+ gradient; or (b) in the presence (extravesicular 150 mM NaCl, intravesicular 300 mM mannitol) or absence (Control, extravesicular 300 mM mannitol, intravesicular 300 mM mannitol) of a Na+ gradient (both extra- and intravesicular pH 7.5). The Na+ gradient experiments (b) were performed in the presence of 10 mM alanine in the extravesicular uptake solution to inhibit any PAT1-mediated uptake. Results are mean±SEM (n=4).](/cms/asset/d0f5ab6b-3b1f-41f7-ad58-f2879aa31262/imbc_a_142160_f0008_b.jpg)
Figure 9. Effects of other amino acids on PAT1- (a) and IMINO-mediated (b) proline uptake in rabbit renal BBMV. [3H]Proline (10 µM) uptake (15 s) into rabbit renal BBMV was measured in the presence or absence of unlabeled amino acids (all 5 mM) in the presence of either an inwardly directed H+ gradient (extravesicular pH 6.0, intravesicular pH 8.4, Na+-free conditions) (a) or an inwardly directed Na+ gradient (both extra- and intravesicular pH 7.5) (b). The Na+ gradient experiments (b) were performed in the presence of 10 mM alanine in the extracellular uptake solution to inhibit any PAT1-mediated uptake. Results are mean±SEM (n=6). ***p<0.001 rabbit PAT1 versus control.
![Figure 9. Effects of other amino acids on PAT1- (a) and IMINO-mediated (b) proline uptake in rabbit renal BBMV. [3H]Proline (10 µM) uptake (15 s) into rabbit renal BBMV was measured in the presence or absence of unlabeled amino acids (all 5 mM) in the presence of either an inwardly directed H+ gradient (extravesicular pH 6.0, intravesicular pH 8.4, Na+-free conditions) (a) or an inwardly directed Na+ gradient (both extra- and intravesicular pH 7.5) (b). The Na+ gradient experiments (b) were performed in the presence of 10 mM alanine in the extracellular uptake solution to inhibit any PAT1-mediated uptake. Results are mean±SEM (n=6). ***p<0.001 rabbit PAT1 versus control.](/cms/asset/a0686a66-ea4a-40d9-8eb8-5994099bb0b5/imbc_a_142160_f0009_b.jpg)