Figures & data
Figure 1. Cer effects on a fluid membrane detected by different probes. (A) Steady-state fluorescence anisotropy of t-PnA (•), DPH (⋄) and NBD (▴) as a function of membrane composition at 24°C. (B) Effect of temperature on t-PnA anisotropy as a function of composition: 24°C (•), 37°C (○) and 65°C (![]()
Figure 2. Mean fluorescence lifetime of the probes as a function of Cer mole fraction.t-PnA (•), DPH (⋄) and NBD (▴), at 24°C; and DPH (♦) at 37°C. Dotted lines are merely guides to the eye.
Figure 3. Thermotropic behavior of POPC/Cer mixtures. Steady-state fluorescence anisotropy of t-PnA (•), DPH (⋄) and NBD (▴) as a function of temperature in MLV composed of (A) pure POPC and pure Cer (▵, using NBD as a probe); and POPC/Cer mixtures containing (B) 20 and (C) 50 mol% Cer. (D) Determination of fluid + gel-to-fluid phase boundary. Steady-state fluorescence anisotropy of t-PnA as a function of temperature in MLV composed of pure POPC (•) and POPC/Cer binary mixtures containing 2 (○), 8 (—), 12 (⋄) and 60 (×) mol% of Cer. The lines are only guides to the eye.
Figure 4. POPC/Cer binary phase diagram and Cer-induced morphological alterations. The full lines are experimentally determined and have quantitative accuracy. The dotted lines (except L7) are the best estimates based on thermodynamic rules, photophysical parameters of the probes and TEM micrographs. The line L7 is based on the t-PnA excitation spectra, and the TEM observations, and is independent of the rest of the diagram. The gray dashed-dotted line is taken from [22]. Abbreviations correspond to: F – fluid phase; G1 – POPC-rich gel phase; G2 – Cer-rich gel phase; G3 – highly ordered Cer-rich gel phase. See text for other details. TEM micrographs correspond to the following compositions: 20 (A), 70 (B), 92 (C) and 100 (D) mol% Cer.
![Figure 4. POPC/Cer binary phase diagram and Cer-induced morphological alterations. The full lines are experimentally determined and have quantitative accuracy. The dotted lines (except L7) are the best estimates based on thermodynamic rules, photophysical parameters of the probes and TEM micrographs. The line L7 is based on the t-PnA excitation spectra, and the TEM observations, and is independent of the rest of the diagram. The gray dashed-dotted line is taken from [22]. Abbreviations correspond to: F – fluid phase; G1 – POPC-rich gel phase; G2 – Cer-rich gel phase; G3 – highly ordered Cer-rich gel phase. See text for other details. TEM micrographs correspond to the following compositions: 20 (A), 70 (B), 92 (C) and 100 (D) mol% Cer.](/cms/asset/29dbe6c6-cbfa-4ee6-80a6-53437555a91d/imbc_a_143930_f0004_b.gif)
Figure 5. Cer platform formation. Variation of FRET efficiency, E, for the donor/acceptor pair t-PnA/NBD, as a function of gel-phase mole fraction in the F + G2 coexistence region along the tie-line at 24°C of the phase diagram in . The black dashed-dotted line corresponds to a value of E calculated for a random distribution of donor and acceptor molecules in the pure fluid phase. The gray dotted line is merely a guide to the eye.
S1 Cer-induced morphological alterations. Transmission electron microscopy images of POPC/Cer mixtures containing (A) 10, (B) 50, (C,D) 90 and (E,F) 96 mol% of Cer. Up to 10% Cer, the vesicles present a mean diameter of 100 nm and are round-shaped. With increasing amounts of Cer, vesicles tend to increase in size, aggregate and originate tubular structures. For very high Cer concentrations (∼92%) crystal formation starts to occur. Pure Cer crystals present a well defined crystalline structure, whereas the presence of POPC leads to a greater occurrence of crystal imperfections.
S2 Estimation of particle size by dynamic light scattering. Up to 20% Cer, it was possible to determine the size of the vesicles by DLS, which is in good agreement with TEM micrographs. For higher Cer amounts, size estimation was not possible due to a sharp increase in polydispersity. This is consequence of vesicle aggregation and tubule formation, as observed by TEM.
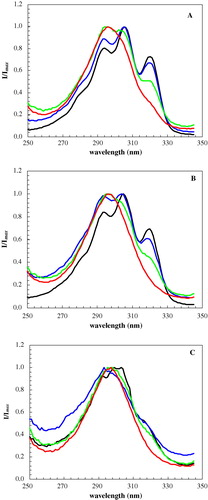
S3 Excitation spectra of t-PnA for POPC/Cer binary mixtures containing 50 (black), 80 (blue), 92 (green) and 100 (red) mol% of Cer at (A) 24°C, (B) 37°C and (C) 65°C. t-PnA exciton formation occurs at very high Cer content and reflects the exclusion of the probe from the highly ordered domains.