Figures & data
Table I. Distinguishing characteristics of endocytic mechanisms. Data are compiled from Citation[3–7] and our unpublished data.
Figure 1. Structures of fluorescent lipid analogues used to evaluate the features critical for caveolar uptake of the lipids. (A) Various headgroups (R) were attached to BODIPY-ceramide, resulting in BODIPY-GalCer, -LacCer, -MalCer, -globoside, -sulfatide, or -GM1. BODIPY-LacCer analogues were also synthesized using various chain length (C12, C16, C18, or C20) sphingosines or BODIPY-fatty acids (C3vs C5 spacer). Fluorescent LacCer bearing an NBD-fatty acid (see panel B) in place of the BODIPY-fatty acid was also synthesized. (B) Structure of the D-isomer of NBD-labeled PC, a glycerolipid. Reproduced from Citation[7] with permission from the American Society for Cell Biology.
![Figure 1. Structures of fluorescent lipid analogues used to evaluate the features critical for caveolar uptake of the lipids. (A) Various headgroups (R) were attached to BODIPY-ceramide, resulting in BODIPY-GalCer, -LacCer, -MalCer, -globoside, -sulfatide, or -GM1. BODIPY-LacCer analogues were also synthesized using various chain length (C12, C16, C18, or C20) sphingosines or BODIPY-fatty acids (C3vs C5 spacer). Fluorescent LacCer bearing an NBD-fatty acid (see panel B) in place of the BODIPY-fatty acid was also synthesized. (B) Structure of the D-isomer of NBD-labeled PC, a glycerolipid. Reproduced from Citation[7] with permission from the American Society for Cell Biology.](/cms/asset/c5e66c6f-7900-4848-b2f1-7a22ad37d4b6/imbc_a_145987_f0001_b.jpg)
Figure 2. Model for GSL-initiated clustering of plasma membrane microdomains. (1) In untreated cells, PM microdomains are too small or transient to be visualized. Certain transmembrane proteins (e.g., ß1-integrins) are dispersed in the membrane. (2) Addition of exogenous GSL or cholesterol to the membrane causes the formation or coalescence of GSL-enriched microdomains. (3) Certain transmembrane proteins and intracellular signaling proteins (e.g., src kinases) become clustered in GSL-enriched microdomains. Clustering leads to protein activation and intracellular signaling.
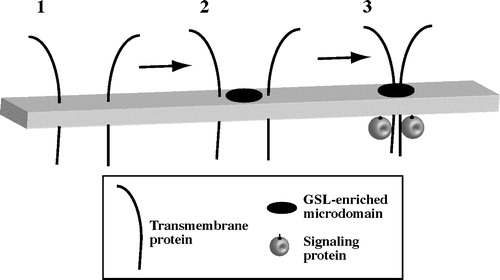
Figure 3. C8-LacCer and cholesterol induce clustering of β1-integrins within GSL-enriched microdomains. (A) Visualization of PM domains after induction by various treatments. Human skin fibroblasts were incubated with BODIPY-LacCer for 30 min at 10°C, washed, and then incubated in buffer alone (untreated) or with C8-LacCer, Mβ-CD/cholesterol complex, or ß1-integrin IgG for 30 min at 10°C. In the far right panel, cells were preincubated with 5 mM mß-CD to deplete cholesterol and then treated with BODIPY-LacCer and ß1-integrin IgG. The samples were then washed and observed by fluorescence microscopy at green and red BODIPY emission wavelengths. Samples were maintained at 10°C at all times to prevent endocytosis. Micrographs shown are overlays of red and green images. Areas outlined with white rectangles are further magnified in insets. Yellow orange patches indicate regions with the highest red signal, indicating enrichment of BODIPY-LacCer in these regions of the PM. Bar, 5 µm. (B) β1-integrin clusters are localized to PM lipid domains. Cells were co-labeled with BODIPY-LacCer and Alexa647 anti-β1-integrin Fab fragments for 30 min at 10°C. Samples were then further incubated for 30 min at 10°C±C8-LacCer, washed, and viewed by fluorescence microscopy. Images were acquired at red and green (for BODIPY as above) and at far red wavelengths for AF647-ß1-integrin Fab labeling. Note the overlap of integrin staining (shown in blue) with the enriched (red/orange) PM domains of BODIPY-LacCer. Bar, 2 µm. Reproduced from Citation[36] with permission from the American Association for Cancer Research.
![Figure 3. C8-LacCer and cholesterol induce clustering of β1-integrins within GSL-enriched microdomains. (A) Visualization of PM domains after induction by various treatments. Human skin fibroblasts were incubated with BODIPY-LacCer for 30 min at 10°C, washed, and then incubated in buffer alone (untreated) or with C8-LacCer, Mβ-CD/cholesterol complex, or ß1-integrin IgG for 30 min at 10°C. In the far right panel, cells were preincubated with 5 mM mß-CD to deplete cholesterol and then treated with BODIPY-LacCer and ß1-integrin IgG. The samples were then washed and observed by fluorescence microscopy at green and red BODIPY emission wavelengths. Samples were maintained at 10°C at all times to prevent endocytosis. Micrographs shown are overlays of red and green images. Areas outlined with white rectangles are further magnified in insets. Yellow orange patches indicate regions with the highest red signal, indicating enrichment of BODIPY-LacCer in these regions of the PM. Bar, 5 µm. (B) β1-integrin clusters are localized to PM lipid domains. Cells were co-labeled with BODIPY-LacCer and Alexa647 anti-β1-integrin Fab fragments for 30 min at 10°C. Samples were then further incubated for 30 min at 10°C±C8-LacCer, washed, and viewed by fluorescence microscopy. Images were acquired at red and green (for BODIPY as above) and at far red wavelengths for AF647-ß1-integrin Fab labeling. Note the overlap of integrin staining (shown in blue) with the enriched (red/orange) PM domains of BODIPY-LacCer. Bar, 2 µm. Reproduced from Citation[36] with permission from the American Association for Cancer Research.](/cms/asset/bf6e1faa-d340-4bbf-856a-9099a6289522/imbc_a_145987_f0003_b.jpg)