Figures & data
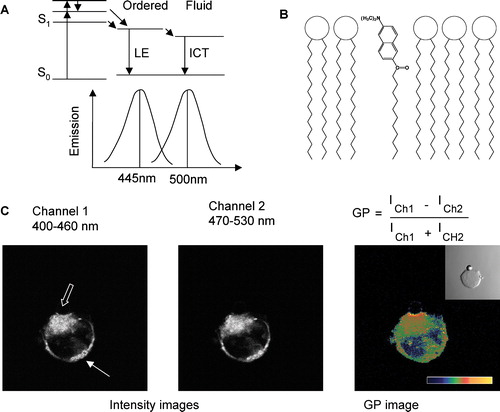
Figure 1. (A) The Jablonski diagram of Laurdan illustrates adsorption, solvent relaxation to, and emission from two, different excited states; LE (locally excited) state in less polar environments and ICT (internal charge transfer) state in more polar environments. A schematic representation of the corresponding emission maxima of Laurdan in ordered and fluid phases is also shown. (B) Structure of Laurdan and its orientation in a phospholipid layer. (C) Intensity images of channel 1 (Ch1: 400–460 nm), channel 2 (Ch2: 470–500 nm) and the corresponding GP images of Laurdan-labeled T-cells activated with a bead coated with anti-CD3 antibodies (see phase-contrast image in insert in GP image). The GP image is pseudo-colored as indicated by the scale with GP from −1 to +1. The solid arrow points to an area in the cell with equal intensity in both channels resulting in a low GP value (green). The hollow arrow points to the T cell activation site, which has a higher Laurdan intensity in channel 1 resulting in a higher GP value (yellow).