Figures & data
Figure 1. Detection of inhomogeneities in lipid mixing by measuring contact-dependent fluorescence quenching. Bilayers are prepared from a mixture of sterol, an unlabeled phospho- or sphingolipid and (black circles) a spin-labeled or brominated quencher lipid, and incorporating a small amount of a fluorescent probe (grey circles). (A, B) If lipid mixing is random (panel A) throughout the range of compositions examined, a plot of the normalized fluorescence intensity vs. mol% quencher lipid is monophasic with a nearly exponential form (panel B). (C, D) By contrast, if for some compositions the lipid bilayer exhibits a markedly inhomogeneous distribution of lipids on a scale of a few nm or larger (panel C), the plot of normalized fluorescence vs. bilayer quencher content (panel D, solid curve) will deviate from the behavior expected for random mixing (dashed curve) over the range of compositions for which inhomogeneity is present. In the example shown the fluorescent species associates preferentially with domains enriched in the nonquenching major lipid species.
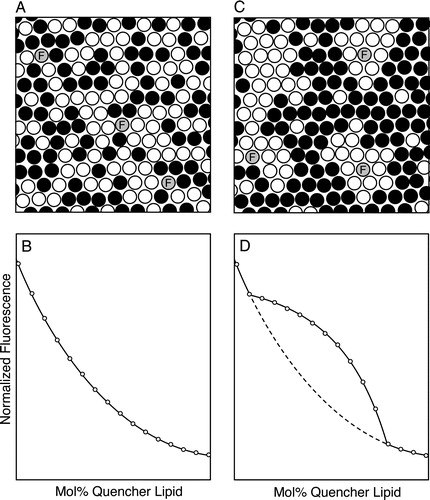
Figure 2. FRET efficiency profiles for different possible distributions of fluorescent donor- and acceptor-labeled species in the membrane. The acceptor density is plotted as the average number of acceptor molecules per area element of size Ro2 (Ro=Förster radius). (A) Random distribution of donor and acceptor molecules within the membrane; the different curves are calculated for the indicated ratios of the distance of closest possible approach of donor and acceptor fluorophores (Re) to Ro, using equation [17] from Wolber and Hudson ([Citation1979]). (B) Thirty percent of the donor and acceptor molecules are co-clustered even at low concentrations in the membrane, while the remainder is randomly distributed in the membrane plane. The value of the y-intercept depends on the spacing of donor and acceptor species within clusters and does not provide an accurate estimate (though it may provide a lower bound) for the fraction of molecules clustered. The data scatter shown is representative of that generally observed in measurements of this type. (C) The donor and acceptor species are exclusively restricted to domains comprising 33% of the total membrane area. (D) The donor and acceptor species are 5-fold enriched in domains that comprise 20% of the total surface area of the membrane. In Panels C and D, the predicted FRET efficiency profiles (curves labeled ‘restricted’ and ‘enriched,’ respectively) are markedly different from the profiles predicted for a random distribution of donors and acceptors. However, unless both the x- and y-axis axis data can be accurately calibrated in terms of the absolute density of acceptor molecules in the membrane and the absolute FRET efficiency, respectively, the efficiency profiles can easily be fit within typical experimental error to the form expected for a random distribution (compare the ‘random’ curves to the ‘restricted (rescaled)’ or the ‘enriched (rescaled)’ curves in panels C and D, respectively).
![Figure 2. FRET efficiency profiles for different possible distributions of fluorescent donor- and acceptor-labeled species in the membrane. The acceptor density is plotted as the average number of acceptor molecules per area element of size Ro2 (Ro=Förster radius). (A) Random distribution of donor and acceptor molecules within the membrane; the different curves are calculated for the indicated ratios of the distance of closest possible approach of donor and acceptor fluorophores (Re) to Ro, using equation [17] from Wolber and Hudson ([Citation1979]). (B) Thirty percent of the donor and acceptor molecules are co-clustered even at low concentrations in the membrane, while the remainder is randomly distributed in the membrane plane. The value of the y-intercept depends on the spacing of donor and acceptor species within clusters and does not provide an accurate estimate (though it may provide a lower bound) for the fraction of molecules clustered. The data scatter shown is representative of that generally observed in measurements of this type. (C) The donor and acceptor species are exclusively restricted to domains comprising 33% of the total membrane area. (D) The donor and acceptor species are 5-fold enriched in domains that comprise 20% of the total surface area of the membrane. In Panels C and D, the predicted FRET efficiency profiles (curves labeled ‘restricted’ and ‘enriched,’ respectively) are markedly different from the profiles predicted for a random distribution of donors and acceptors. However, unless both the x- and y-axis axis data can be accurately calibrated in terms of the absolute density of acceptor molecules in the membrane and the absolute FRET efficiency, respectively, the efficiency profiles can easily be fit within typical experimental error to the form expected for a random distribution (compare the ‘random’ curves to the ‘restricted (rescaled)’ or the ‘enriched (rescaled)’ curves in panels C and D, respectively).](/cms/asset/3108ed47-8620-444e-adab-c2c3e946a7e2/imbc_a_147283_f0002_b.jpg)