Figures & data
Figure 1. Top view of the focal plane and detection volume (top left). Optical species are spotted by the detector only if they diffuse into the detection volume. Scheme of a confocal microscope for dual-color fluorescence correlation spectroscopy (top right). Fluorescence fluctuations are recorded over time and applied to the correlation algorithm. The correlation function G(τ) is plotted as a function of time τ (bottom). This Figure is reproduced in color in Molecular Membrane Biology online.
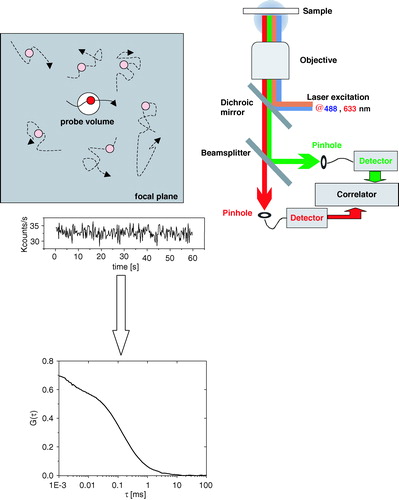
Figure 2. An accurate positioning of the focal volume on the membrane bilayer is crucial to record artifact-free correlation curves. G(τ) strongly changes as a function of the distance of the focal plane with respect to the bilayer along the optical axis z (top). As a consequence, both the particle diffusion time (bottom left) and the particle number in the detection volume (bottom right) change as a function of the distance of the focal volume from the membrane.
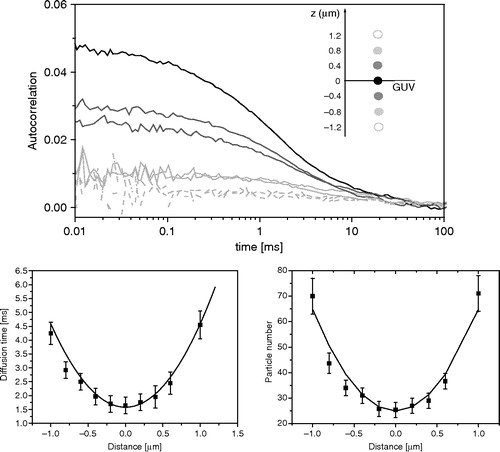
Figure 3. (A) Confocal image of GUVs composed of DOPC and 0.1 mol% of DiI-C18 (left panel) and 3D projection of a GUV reconstructed from a stack of confocal images at different z-positions (0.4 µm thick). (B) Lateral diffusion coefficients of various lipid analogs (0.001 mol%) diffusing in GUVs composed of DOPC. This Figure is reproduced in color in Molecular Membrane Biology online.
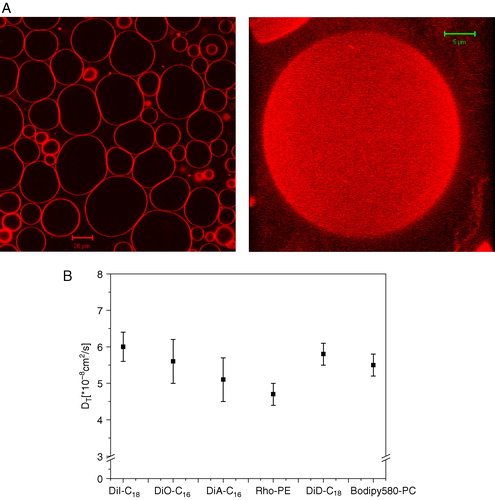
Figure 4. (A) Lipid lateral diffusion coefficient as a function of molar percentage of cholesterol for DOPC/cholesterol (circles; left axis) and SM/cholesterol (triangles; right axis) mixtures. (B) Confocal image of GUVs composed of DOPC/cholesterol 1:1 and 0.1 mol% of DiI-C18. (C) Lipid lateral diffusion coefficient as a function of molar percentage of cholesterol for DOPC/SM/cholesterol mixture (black squares: total lipid mixture – no phase separation; grey squares: DOPC-enriched, Ld phase; triangles: SM-enriched, Lo phase). The dashed line sets the diffusion coefficient in pure DOPC GUVs. (D) Confocal image of GUV composed of DOPC/SM/cholesterol 1:1:1 mixture, 0.1 mol% of DiI-C18 (red) and 0.1 mol% of GM1 (bound to AF488-labeled CTX, green).
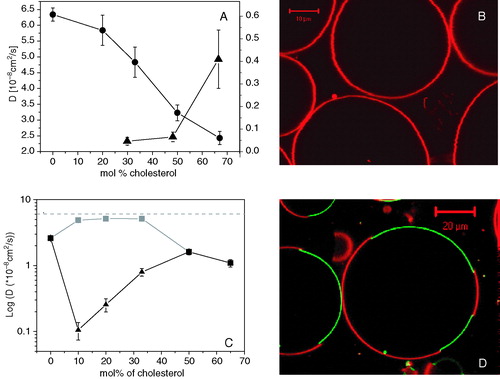
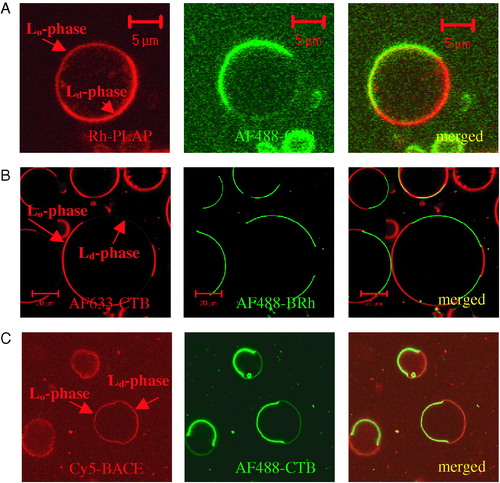
Figure 5. (A) Confocal images of GUVs composed of SM/DOPC/cholesterol 1:1:1 and 0.1% of GM1 containing the GPI-anchored rhodamine-labeled PLAP (Rh-PLAP). Red channel: fluorescence signal from Rh-PLAP, which partitions for 25% in the Lo-phase. Green channel: fluorescence signal from AF488-labeled cholera toxin (AF488-CTB), which partitions for 99% in the Lo phase. (B) Confocal images of GUVs composed of SM/DOPC/cholesterol 1:1:1 and 0.1% of GM1 containing the multi-spanning protein AF488-labeled bacteriorhodopsin (AF488-BRh). Red channel: fluorescence signal from AF633-labeled cholera toxin (AF633-CTB), which partitions for 99% in the Lo phase. Green channel: fluorescence signal from AF488-labeled bacteriorhodopsin (AF488-BRh), which partitions for 99% in the Ld phase. (C) Confocal images of GUVs composed of SM/DOPC/cholesterol 1:1:1 and 0.1% of GM1 containing the single-span Cy5-labeled BACE (Cy5-BACE). Red channel: fluorescence signal from Cy5-BACE, which partitions for 20% in the Lo phase. Green channel: fluorescence signal from AF488-labeled cholera toxin (AF488-CTB), which partitions for 99% in the Lo phase.